Investing.com’s stocks of the week
UPTREND ENDING ON MONDAY - 04/13 & NEW DOWNTREND STARTING ON 4/14
If you have been following my articles, you might remember that my last article predicated an uptrend that could go up and challenge our high of S&P 500 2119.
When I wrote that article, I referred to the last downtrend. It ended near 2050 on Thursday - 04/02/15. Since then we closed at 2102 last Friday - 04/10/15. That's a nice gain of +52 points on the S&P500.
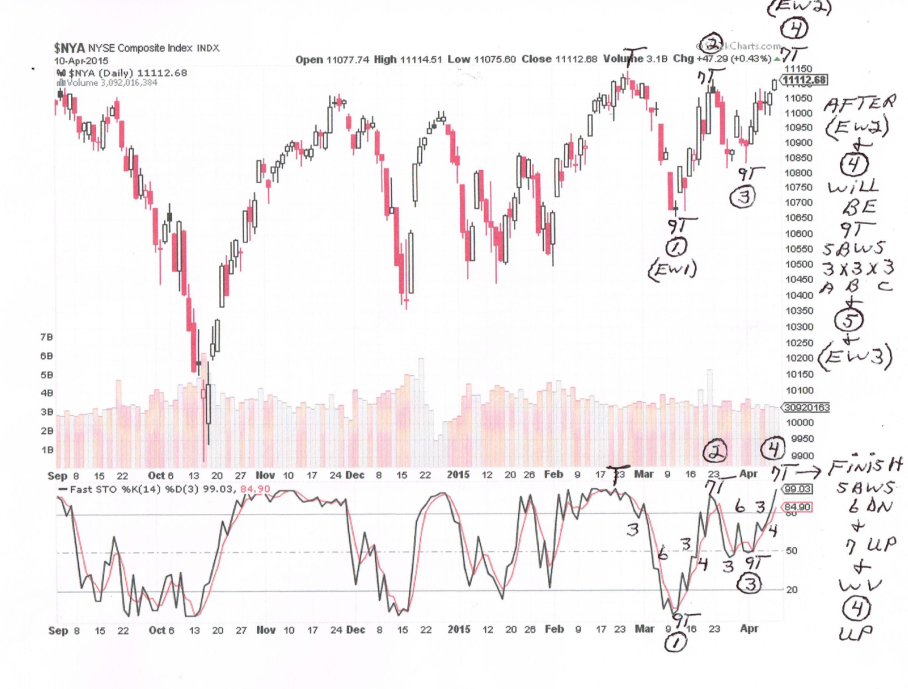
Now lets see if my Elliott Waves will be good to me again. I will be ending my wave-4 uptrend tomorrow (4/13) and starting a "new" downtrend on the following Tuesday (4/14).

My target for this "new" wave-5 down is the 200 day moving average of 2016. That will be -86 S&P500 points down and actually we could go up to the 2112 to 2114 level on Monday. If we get to the 2114 level, then that will be -98 S&P500 points down.
Of course, we don't know if we will go that low, but one reason I believe we could, is that a a wave-5 down is also called an Elliott Wave-3 and Elliott Wave-3s are noted for their power.
One other thing I wanted to mention, is that one of my technical friends noted that there is something called the Bradley Model, that pinpointed a date of 4/15, as the date the bull market might end. It used the low of 676 from the 2009 bear market. The model says - 676 X Pi(3.14) = 2122 for a S&P500 high. Remember our current high is 2119 and we could reach 2122 tomorrow. Now that's amazing!
I have included my NYSE chart again to show you my waves & sub wave counts. Notice that up waves have 7 sub waves up and down waves have 9 sub waves down. That is also "amazing" because we are getting repeated wave counts and by the way they are "bear" market A/B/Cs of 3x3x3=9 & 3x1x3=7.
