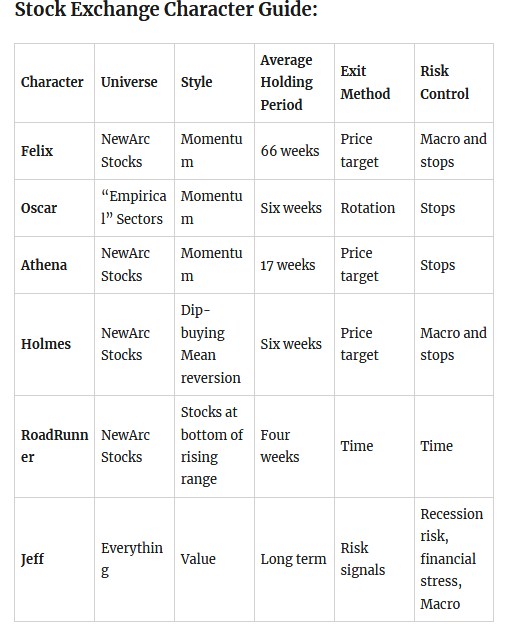
The Stock Exchange is all about trading. Each week we do the following:
- discuss an important issue for traders;
- highlight several technical trading methods, including current ideas;
- feature advice from top traders and writers; and,
- provide a few (minority) reactions from fundamental analysts.
We also have some fun. We welcome comments, links, and ideas to help us improve this resource for traders. If you have some ideas, please join in!
Review:
Our previous Stock Exchange discussed ideas for limiting risk in a volatile market. We reviewed the advantages of being disciplined and objective in avoiding emotional errors when volatility increases. If you missed it, a glance at your news feed will show that the key points remain relevant.
This Week: Did You Get Stopped Out?
Using simple price stops to limit your risk can protect against losses. However, it can also result in the unfortunate situation of automatically exiting your trading positions near the bottom, only to watch prices quickly revert higher thereby causing you to miss out on significant profits. For example, many traders using simple price stops were exited from their positions near the bottom last week, thereby missing out on subsequent gains in the days that followed.
Our trading models consider multiple factors beyond simple price stops. For example, Dr. Steenbarger does an excellent job (as usual) explaining one such factor that can also be taken into consideration: Volume. In this article, he explains how combining both price and volume data can provide a more complete picture to help you execute profitable momentum trades, and avoid potential false positives. According to Dr. Steenbarger:
“When we see added volume, it means that the proportion of directional traders relative to market makers has increased. This facilitates market movement. Conversely, when we see volume dry up, it means that directional traders are not perceiving opportunity in that instrument. That leads to less movement on all time scales and what short-term traders experience as “choppy”.”
Another factor we like to monitor is the short-term technical health of the market. As noted recently, the short-term technical health of the market moved from bullish to neutral (with the potential to move negative) for the first time in months (even though the long-term health remained strongly bullish). And when short-term market health moves to negative we will exit some or all of our trading positions. We have examples of positions we recently exited (and a few we just entered) later in this report.
Model Performance:
Per reader feedback, we’re continuing to share the performance of our trading models, and the following table shows this week’s update.
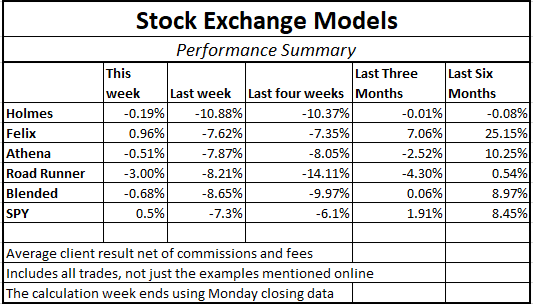
Important to note, we find that blending a trend-following / momentum model (Athena) with a mean reversion / dip-buying model (Holmes) provides two strategies, effective in their own right, that are not correlated with each other or with the overall market. By combining the two, we can get more diversity, lower risk, and a smoother string of returns.
| And for these reasons, I am changing the “Trade with Jeff” offer at Seeking Alpha to include a 50-50 split between Holmes and Athena. Current participants have already agreed to this. Since our costs on Athena are lower, we have also lowered the fees for the combination. |
If you have been thinking about giving it a try, click through at the bottom of this post for more information. Also, readers are invited to write to main at newarc dot com for our free, brief description of how we created the Stock Exchange models.
Expert Picks From The Models:
This week’s Stock Exchange is being edited by Blue Harbinger ( a source for independent investment ideas).
Holmes: This week I bought Avis Budget Group (CAR). Are you familiar with this one?
Blue Harbinger: Holmes—Welcome back! You haven’t shared one of your ideas with me in weeks. And yes, I know Avis Budget Group. This company rents cars (Avis, Budget) and shares cars (Zipcar). Why do you like this stock, Holmes?
Holmes: CAR’s dip over the last month is the sort of set up I like to see. From the chart below, you can see it is below its 50-day moving average, and it has attractive upside over the next six weeks.
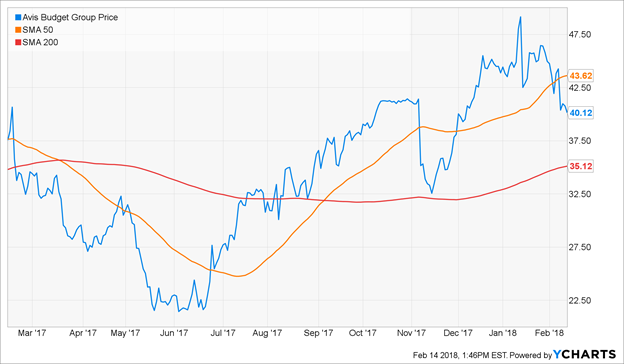
BH: Interesting, Holmes. I suppose you could argue that a lot of stocks present a good dip-buying opportunity right now after the recent market sell off, but I agree CAR’s pullback has been more pronounced. Are you concerned with what SRS Investment Management is trying to do? They control nearly 15% of the voting shares, and CAR recently set up a poison pill to protect other shareholders. SRS is still vying for more board seats too, you know.
Holmes: I am aware, but not concerned about that.
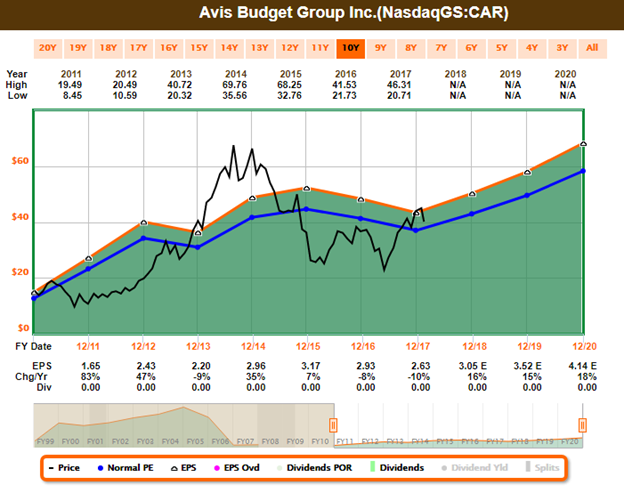
BH: This company has a lot of debt, and very low profit margins. Here is a look at the Fast Graph.
Holmes: Check back with me on this one in about six weeks, and we’ll see how this trade works out.
BH: I will. And how about you, Road Runner–do you have any updates for us on your trades? For example, whatever happened to your Amazon (NASDAQ:AMZN) (AMZN) trade from last week?
Road Runner: I’m still holding Amazon, Blue Harbinger. I bought it on February 5th. Here is a look at my “buy” chart and my “hold” chart.
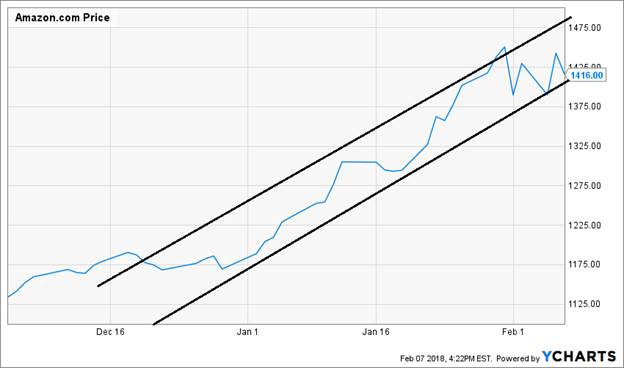
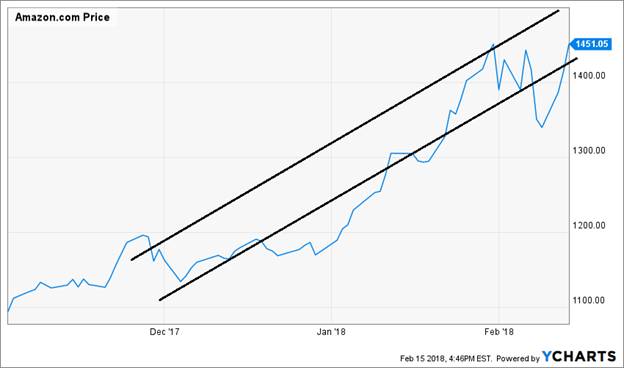
BH: I can see why you bought it. As you explained last week, you like to buy stocks at the bottom of a rising channel and then hold them for about 4 week. Why didn’t you sell though? Based on the second chart, it moved way below that rising channel last week.
RR: I don’t use strict stop orders to exit my trades. I look at other factors too, such as the ones discussed earlier in this article (e.g. volume, overall market health). I’m still holding my shares.
BH: I cannot blame you. I like Amazon. As I wrote before: “I’m impressed by a company that can go from an online bookstore, to a $650 billion market cap company that is beating Microsoft (NASDAQ:MSFT) in cloud and displacing struggling “brick and mortar” retailers of many types.” And by the way, Road Runner, I didn’t panic and sell any of my stocks last week either.
RR: Actually, I did make a sale this week. I sold my Valeant (VRX) shares on February 13th. As you recall, I purchased these shares back on January 18th. Here is a look at my “buy” chart followed by my “sell chart.
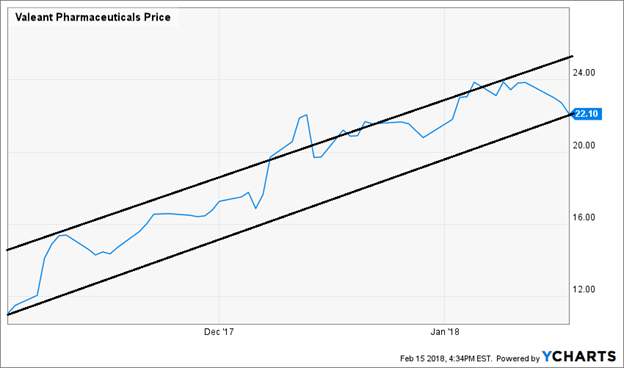
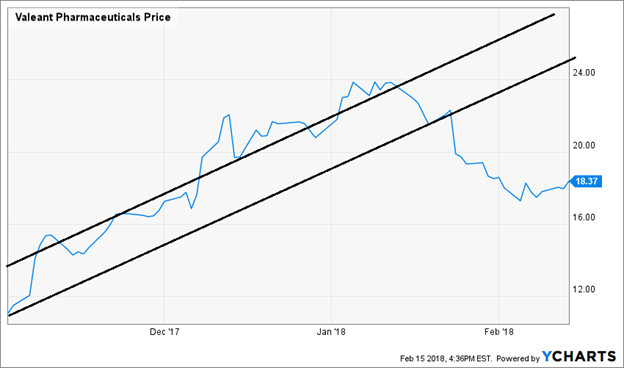
BH: Unlike the Amazon chart you shared earlier, Valeant fell quite a bit below that rising channel you like. Is that why you sold.
RR: Again, my sell decisions are not based on price alone. I look at other factors too, such as the ones discussed earlier in this article (e.g. volume, overall market health).
BH: Okay. Thanks for those updates. How about you, Athena—what have you got this week?
Athena: I like Netflix (NASDAQ:NFLX) (NFLX).
BH: Another FAANG stock. What do you like about Netflix, Athena?
Athena: I am a momentum trader. Here is a look at the chart.
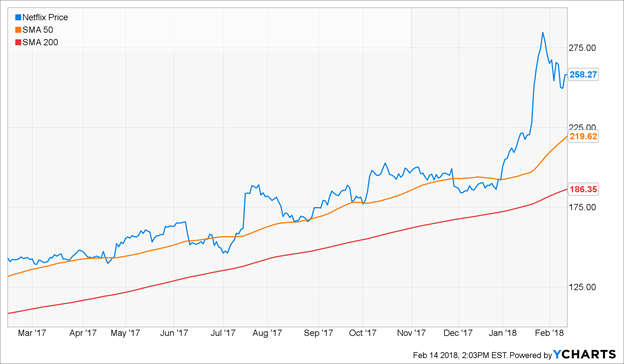
BH: You certainly are a momentum trader. It takes bravery to buy a stock that’s just rallied 45% already this year.
Athena: Not really. I’m a model, No bravery involved. Just data and objectivity.
BH: Honestly Athena, I like Netflix too, but for different reasons than you. I recognize that Netflix has an enormous total addressable market, and so many people are just looking for an excuse to cut their cable TV, and for many people Netflix is the solution. By the way, Netflix crushed revenue estimates (in a good way) last month, and the company also knocked it out of the ballpark on new subscribers. Here is a look at the Netflix Fast Graph.
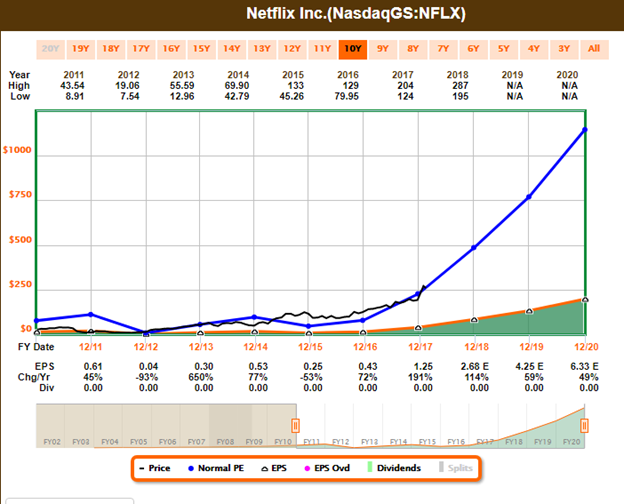
Athena: Thanks for the information, but you seem focused on long-term growth. My typical holding period is only about 17-weeks.
BH: Either way, I still like the stock. How about you Felix—what have you got this week?
Felix: I sold my Urban Outfitters (NASDAQ:URBN) shares on February 14th. If you recall, I bought these shares back on 7/17/17. Here what I said back in July when I bought the shares:
“Urban Outfitters URBN looks extremely uncool right now, and to me, that’s the coolest thing about it. The month and a half long lull is signaling a bottom to me. As a longer term investor, that’s a very important factor.”
And here is a look at the price chart since then.
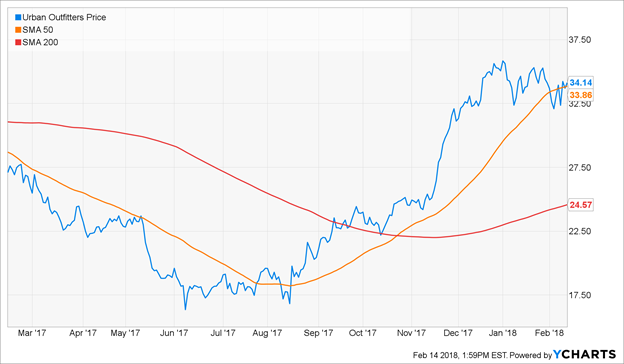
BH: nice one, Felix—I am impressed. You did well on Urban Outfitters. Do you have anything else for us this week?
Felix: Yes, I also reviewed the stocks in the Nasdaq 100 (QQQ) and my top 20 are listed below.

BH: Thanks for the list. Similar to Athena and Road Runner, I see you also like Netflix and Amazon. And I also see NVIDIA (NASDAQ:NVDA) is ranked at the top of your list. I like NVIDIA. They dominate in video game GPUs, there is so much demand for their chips in data centers that they cannot quite keep up, and on the distant horizon they’re eventually going to have AI chips in just about every new car manufactured, if things go well. I even don’t mind the strong price appreciation over the last year considering earnings and guidance both keep going up too.
BH: How about you Oscar—do you have anything to share this week?
Oscar: This week I’m sharing my top 20 ETFs from my diverse ETF universe. Here is the list.

BH: I see IBUY (IBUY) has returned to the top of your list again. This is the online retail ETF that gets people excited about the continuing evolution of more retail sales moving online. I see also that IBUY’s top 10 holdings include Netflix and Amazon. These are clearly momentum investor favorites.

Thanks for sharing, Oscar. I know you are a momentum trader, your typical holding period is about six weeks, and when you exit you usually rotate into another sector.
Conclusion:
Recent market volatility has reminded many traders of the critical importance of risk management. However, simple price-based stop orders can cause subsequent rebound opportunities to be missed. Stop orders can be improved upon with multiple factors including trading volume data and short-term technical health indicators. We find combining factors and trading styles helps us control risks, while providing an attractive return stream with a lower correlation to the overall market.
Background On The Stock Exchange:
Each week, Felix and Oscar host a poker game for some of their friends. Since they are all traders, they love to discuss their best current ideas before the game starts. They like to call this their “Stock Exchange.” (Check out Background on the Stock Exchange for more background). Their methods are excellent, as you know if you have been following the series. Since the time frames and risk profiles differ, so do the stock ideas. You get to be a fly on the wall from my report. I am usually the only human present and the only one using any fundamental analysis.
The result? Several expert ideas each week from traders, and a brief comment on the fundamentals from the human investor. The models are named to make it easy to remember their trading personalities.
