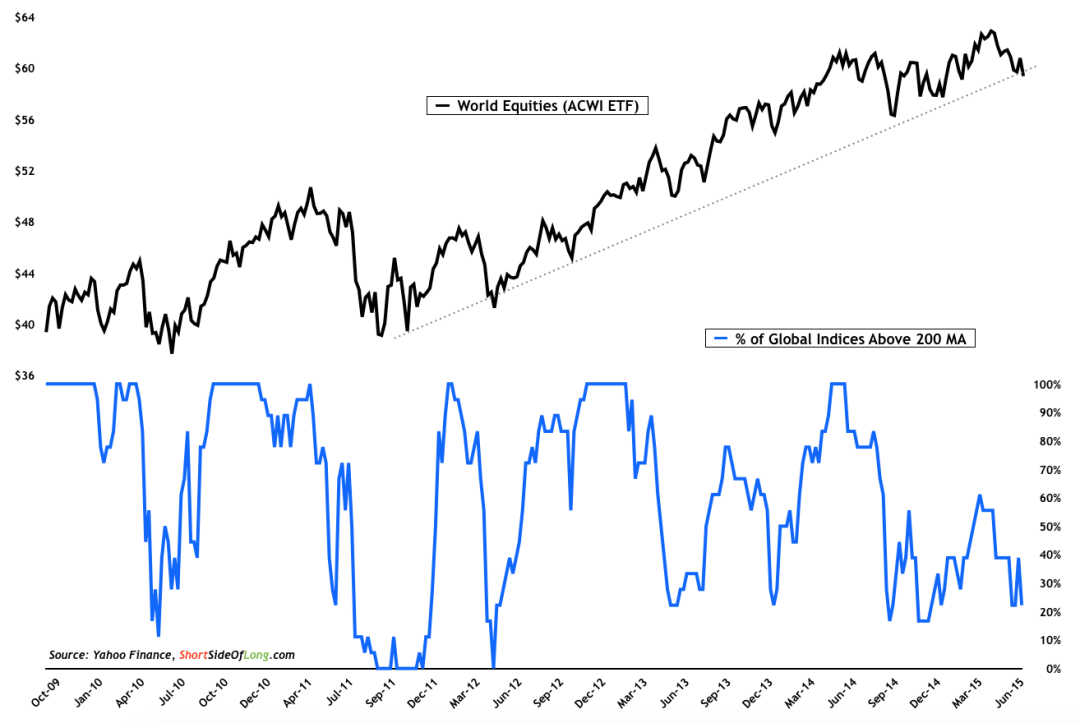
Chart Of The Day 1: Global equities participation is becoming very narrow

Source: Short Side Of Long
We continue to follow the global equity picture, as a majority of the markets remain in correction. This past week finished with a very weak close as the All Country World Index (NASDAQ:ACWI) broke down below its major uptrend line. While the S&P 500 (via SPDR S&P 500 (ARCA:SPY)) managed to rally all the way back towards its bull market high last week, it has lost the majority of those gains this week. At the same time, other equity regions around the world are still struggling.
As of this writing, fewer than 25% of major global equity indices are trading in an uptrend, or above their respective 200 day moving averages. This tells us two important points: a) participation is narrowing; and b) breadth isn’t yet at extreme oversold levels to consider buying equities.
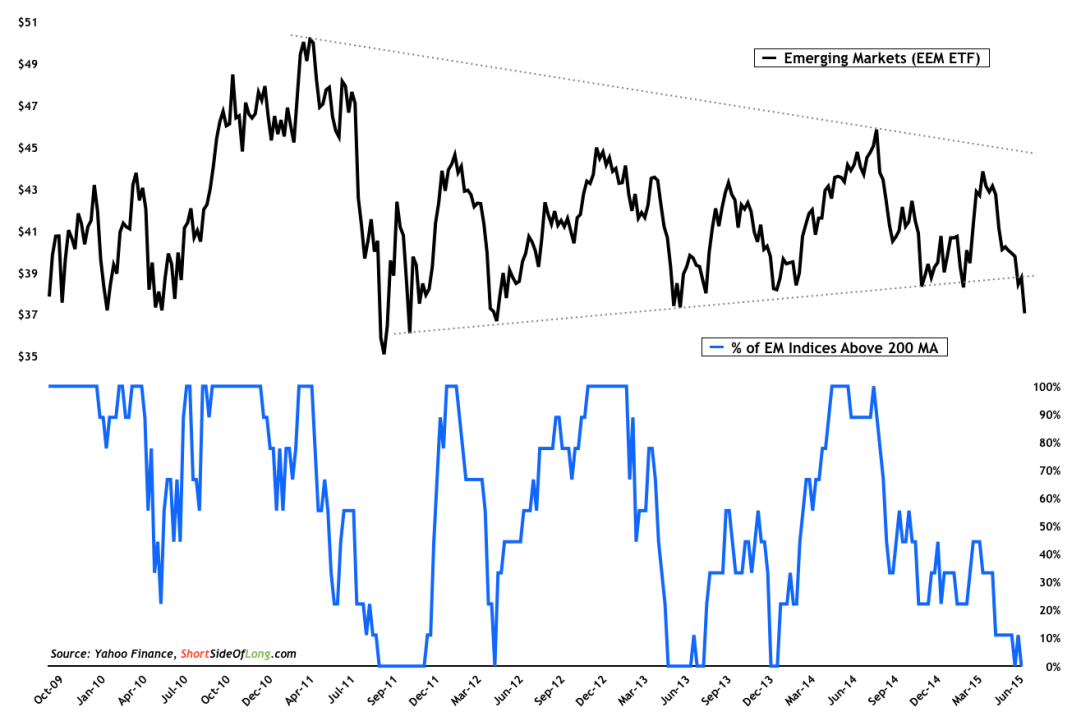
Comparing this to Emerging Market equities (via iShares MSCI Emerging Markets (ARCA:EEM)), we can see that participation is totally negative and we have a major technical break in place. While the market is oversold, readers need to remember that a prolonged period of consolidation can sometimes lead to powerful trending movement. The question is, how low could the EM Index go?
Chart Of The Day 2: Emerging market equities are currently breaking down

Source: Short Side Of Long
