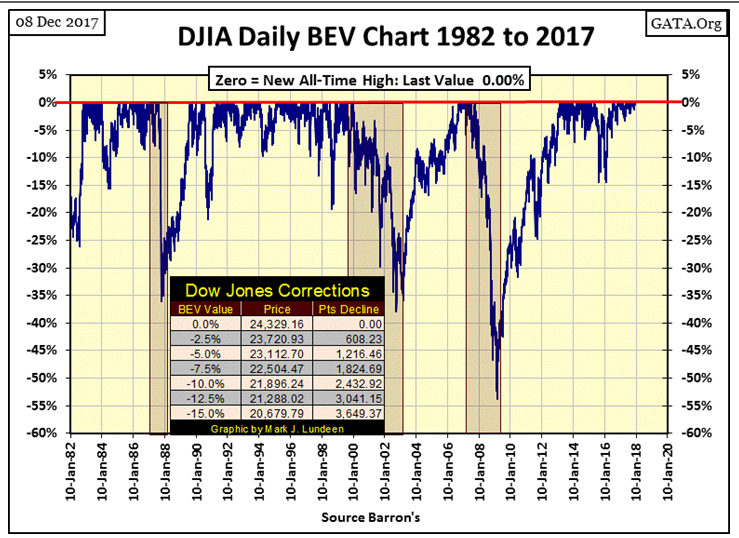
Once again, the Dow Jones closed the week at a new all-time high, another BEV Zero in the Bear’s Eye View chart below. That makes 82 new all-time highs since last November’s presidential election.That’s 30% of the Dow Jones’ daily closings of the past year have been at new all-time highs. Also, going back to 1982 in the BEV chart below, the true beginning of the current market advance, never before have we seen a concentration of BEV Zeros that simply refuses to correct down to the BEV -5% line. It’s been that way since July 2016.

Next is the Dow Jones (Blue Plot) with its 200 count (Red Plot), the number of days the Dow Jones has moved +/- 2% from a previous day’s closing price in a running 200 day sample. You can tell when Mr Bear is near; the Dow Jones’ 200 count begins rising as the Dow Jones itself comes under pressure.
Currently the Dow’s 200 count is at zero, and has been since August 23rd. Small wonder as the last time the Dow Jones saw a 2% day (day of extreme market volatility) was on November 7th of last year. The day before Donald Trump was elected president, the Dow Jones saw a 2.02% decline from its previous day’s closing price. Since then it’s been up, up and away with the Dow Jones advancing 6,070 points or 33.24% in the past thirteen months.
To read the entire report Please click on the pdf File Below:
