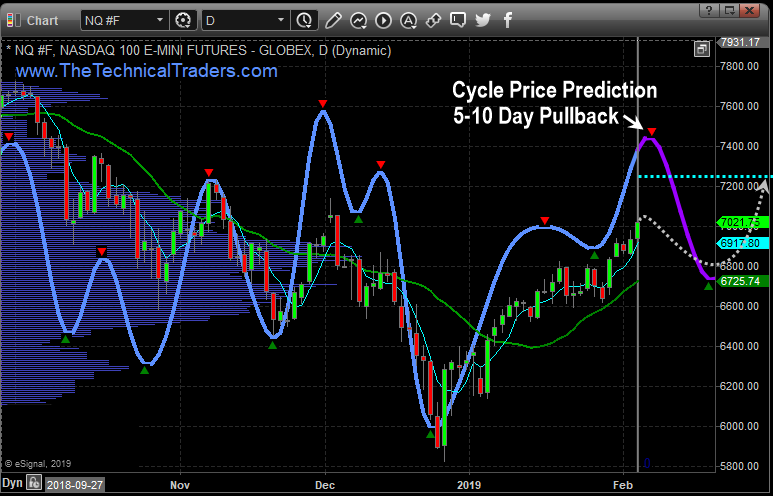
The State Of The Union (SOTU) address presented by President Trump Tuesday night could roil the markets a bit – resulting in some increased market turmoil and rotation over the next 5+ days. Additionally, we believe the tone of this message, as well as the Democratic response to the President's comments, will create a bit of an uneasy forward process for global investors.
Our Adaptive Price Cycle modeling system is suggesting that we will enter a phase of sideways basing over the next 5-10+ days and we believe this analysis is suggesting that uneasy global investors may view the address and any resulting conflicts as a sign that the U.S. may not have a clear pathway forward. Washington DC acts as a leadership think-tank for the global markets. Whenever there is open conflict, a government shutdown or some increased level of uncertainty, U.S. stocks typically become a bit more volatile and choppy while investors settle into forward guidance.
To highlight our thinking/research, we'll start with this Weekly NQ chart. The current price level is about $7021, below the CYAN Fibonacci projected target level. We believe the technology-heavy Nasdaq will continue to move moderately higher over the next 30+ days – yet we feel the overall markets may rotate a bit lower to form a new momentum base after the SOTU address. Which means we would be looking for this new momentum base to setup and for new trading triggers to be generated as a momentum breakout happens.
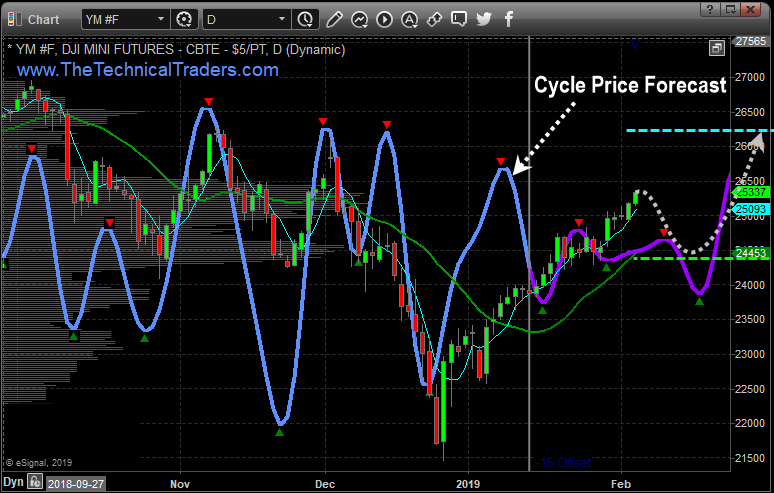
This next chart is the Weekly YM and it clearly shows that the current price is already above the CYAN Fibonacci projected target level. This is important because it highlights the fact that the Nasdaq has been under some pricing pressure as the FAANG stocks have yet to fully recover from the December 2018 lows. It also shows that the Blue Chips and Mid-Caps have already recovered quite substantially over the past 6-7 weeks.
We would not be surprised to see the YM rotate after the address this week to levels near the CYAN Fibonacci target/support level (24,435) while setting up a new momentum base – similar to what we expect to happen in the NQ. It makes sense that this support level (24,435) would be a substantial basing level for a new momentum breakout trade to continue higher.
Our overall longer-term analysis of the U.S. markets is that we continue to believe the upside price bias will continue and that a moderate upside “melt-up” as a renewed capital shift continues to drive investment into the U.S. stock market. Right now, though, we are warning that the U.S. stock markets could be setting up for a period of 5-10+ days of rotation and volatility, after the SOTU address, that may frighten many traders. Because of this, we had our subscribers close out our GDXJ position for a 10.5% gain right at the recent high and also took partial profits on our Roku (NASDAQ:ROKU) stock pick for a quick 8% gain. So be prepared for some sideways trading and increased volatility for the next week or two.


