Today marks the 7th Anniversary of the S&P 500 bottom at 666 following the financial crisis. You will be flooded today with pictures of the chart of the S&P 500 rising off that bottom. And analysis of what has happened. There is some value in what has happened over these 7 years but most of what you read will be will hindsight to draw conclusions about the future. These will only be able to be defended with hindsight years from now.
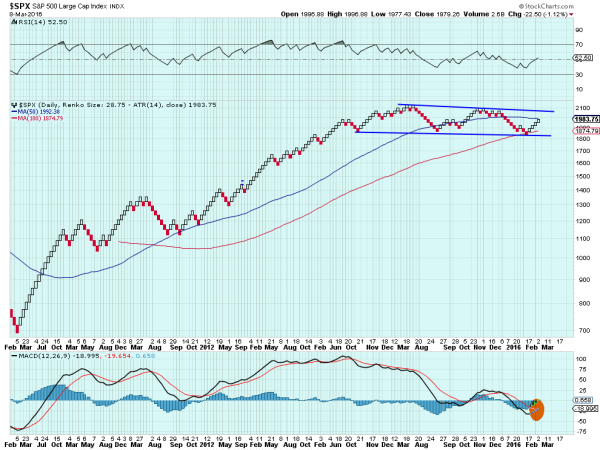
I am going to try to stay away from that and give you some insights that you will not see elsewhere and a chart that I am sure no one else will post. Below is the Renko chart of the S&P 500. This chart is a derivative of a Japanese Candlestick chart mixed with a Point and Figure chart. It uses bricks to show price movement when a move exceeds a predefined amount. Time is secondary and volume is not present.

This one uses the 14 day Average True Range (ATR) as the brick size. The simplicity of this chart is what makes it special. If the brick is white it is a buy, red a sell. You can see that since the low in 2009 there have been a lot more white bricks than red bricks. The trend higher with support from a 50 brick moving average lasted until the high in July 2015. From there it has moved in a consolidation with a slight pullback. With a touch at the 100 brick moving average in February it established a channel. Since then it has been moving higher in the channel.
For a short term trader the S&P 500 is a buy as it rises in the channel. For an intermediate or longer term investor the uptrend remains in charge but with no reason to buy the Index until it clears the channel to the upside. Bearish investors and trades will suggest that this is a long term topping, and they may be right. But the abundance of evidence supports continued faith in the uptrend.
The RSI, a momentum indicator is rising and crossing the mid line, a bullish sign. The MACD another momentum indicator is about to cross up, a buy signal. The bottom of the channel now sits under 1840, and a move below that will prove the bears right, but not until then. It will take a move to about 2060 to break the channel to the upside and renew the bullish trend. In between the battle will continue to be fought.
DISCLAIMER: The information in this blog post represents my own opinions and does not contain a recommendation for any particular security or investment. I or my affiliates may hold positions or other interests in securities mentioned in the Blog, please see my Disclaimer page for my full disclaimer.
