On Friday the US exchanges were closed due to the western Christmas holiday. The stock indices edged slightly lower on Thursday. The trading hours were shortened. The trading volume at the US exchanges was just 2.7bn stocks which is far below the 20 trading days average of 7.5bn stocks. The US dollar index live data show the index fell too on Thursday. The negative stocks and US currency dynamics were in the markets despite the strong weekly labour market data. The number of unemployed is below 300 thousand already for 42 straight weeks. No important macroeconomic data are expected today from the US but some indicators will come out later this week.
European stocks are fluctuating subtly. Adidas (DE:ADSGN) shares lost 0.5% on the news its credit burden may rise by 0.5bn euros in 2016 on currency difference. In general, many investors have left the market on the Christmas holidays. Britain’s market is closed due to Boxing Day. The pan-European Stoxx 600 index edged 5% lower this month showing the weakest performance in the end of the year since December 2002. On Friday, the European stock exchanges were closed due to the western Christmas holiday. Til the end of the year no important economic data are expected in EU.
Today early in the morning negative macroeconomic data came out in Japan. The industrial production and retail sales fell in November more than forecasted. Investors assume this may determine the further monetary easing by the Bank of Japan in order to give boost to the economy. Yen fell slightly while Nikkei edged up. The Bank of Japan aims at 2% inflation while in November it was only 0.1%. Til the end of the year no important economic data are expected to be released in Japan.
In the commodities markets, the trading was thin on Monday. Many European countries and Australia continue celebrating Christmas.
The slowdown in the Japanese economy pushed the oil prices slightly lower on Monday. The sales of the petrochemicals fell 6.9% in November - which is the lowest since 1969 - amounting to 3.04mln barrels a day. The fuel oil consumption fell as well on warm weather.
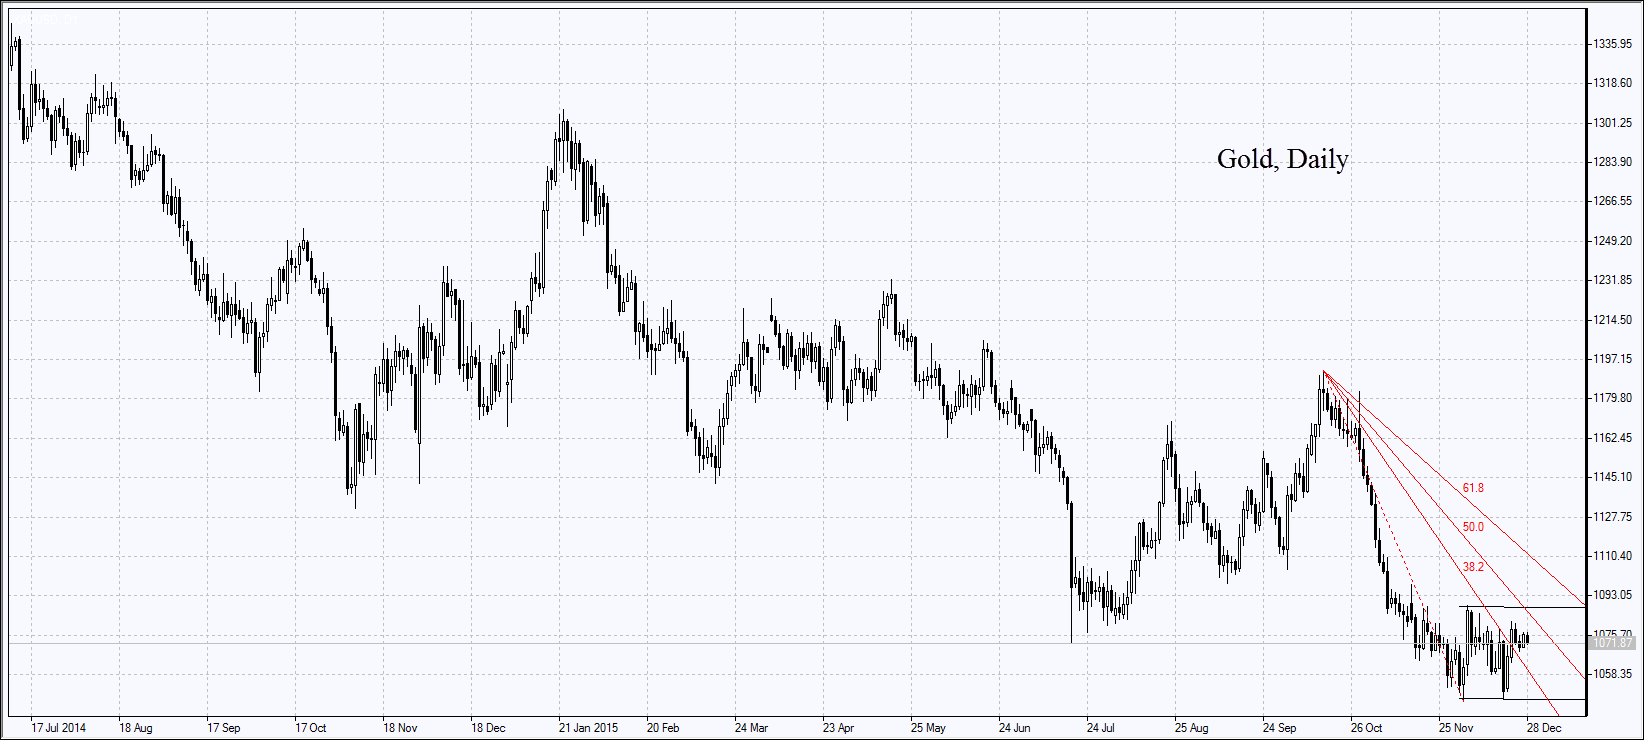
Gold is slightly falling dragged down by oil prices. Market participants have shrugged off the rise in November to 79 tonnes from 71.6 tonnes of net import from Hong Kong to China. Gold lost 9% since the start of the year and is likely to end the 3rd straight year in the red.
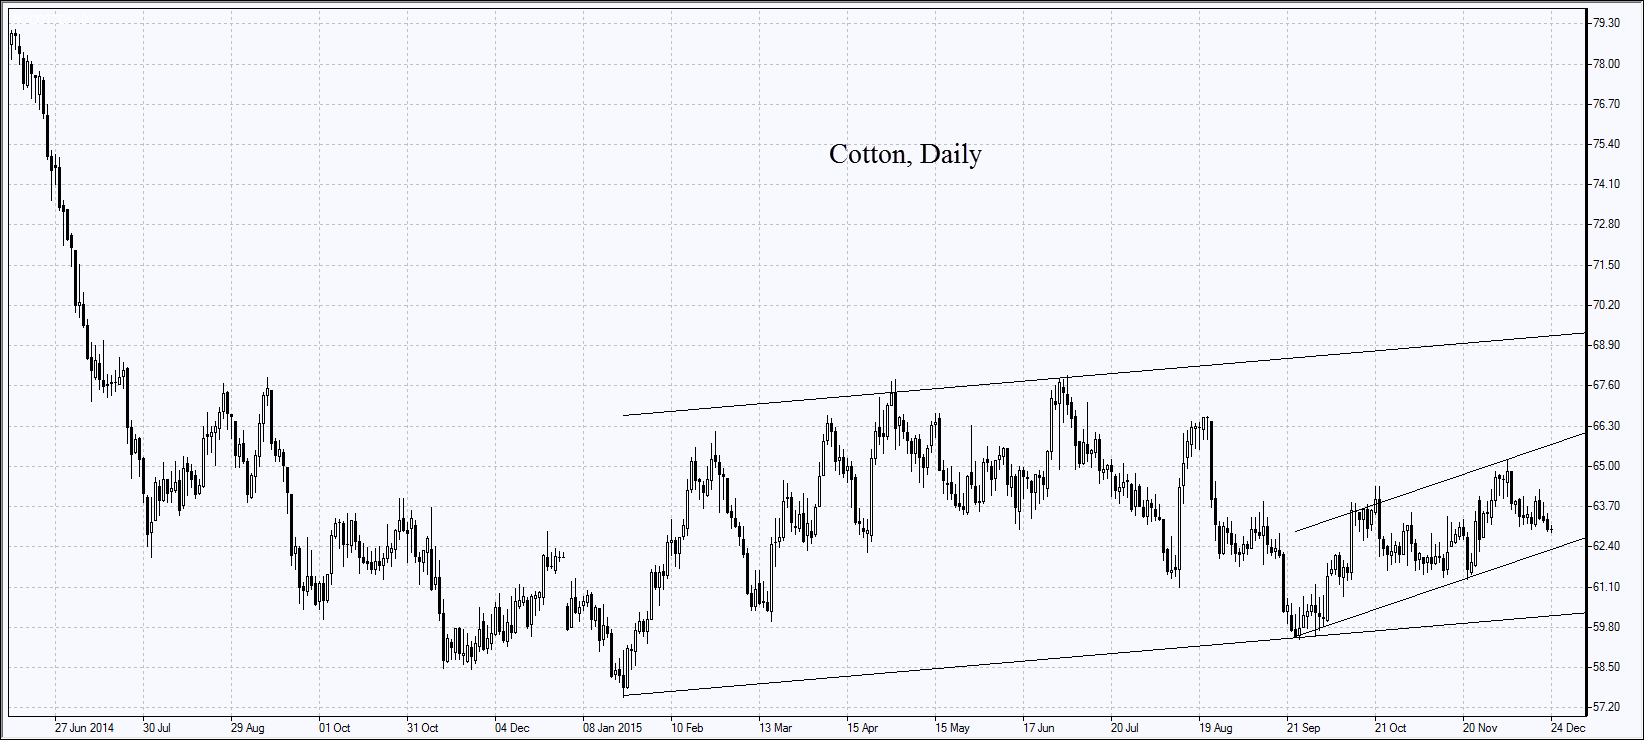
Cotton prices were falling 4 out of 5 days last week. Meanwhile, Pakistan is planning to increase its export in season starting August 1 to 4mln cotton bales, up from 1.8mln a year before. Due to the floods, the cotton production decreased 25% in Pakistan. In India its production may fall by 4%. Cotton trading has not started yet.
Soybeans prices are edging down today for the 5th day in a row. Rainy weather in Brazil favours better crops. The USDA reported the soy export from the US amounted to 2.1mln tonnes last week which is above the predicted 0.9-1.1mln tonnes. The soy export volume was in line with the tentative outlook and its prices are slightly increasing today.
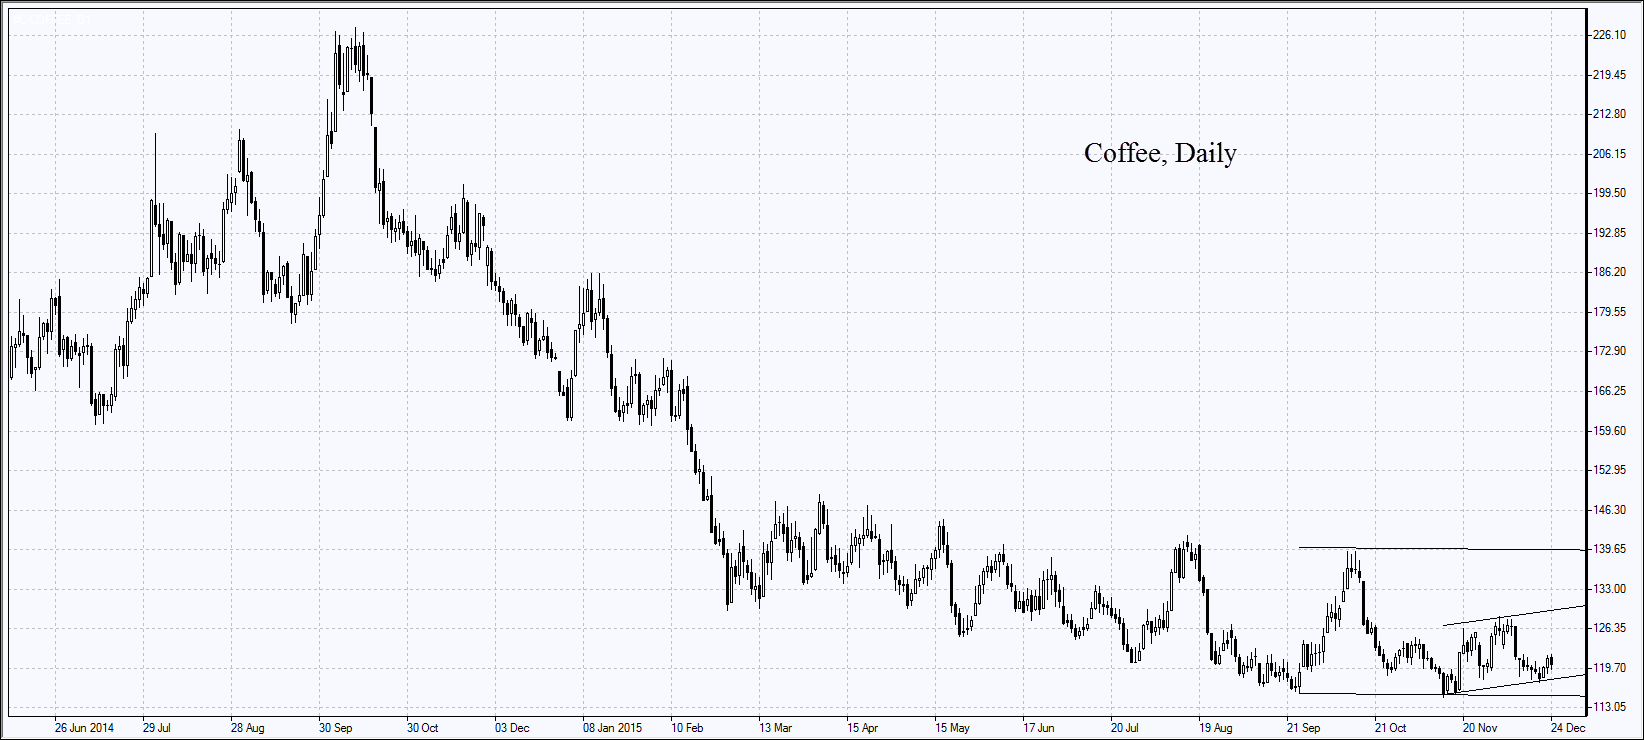
Vietnam reported on Saturday its coffee exports may fall to 1.28mln tonnes in 2015 which is 24.3% below the volume of 2014. Coffee trading has not started yet since the news was released.
