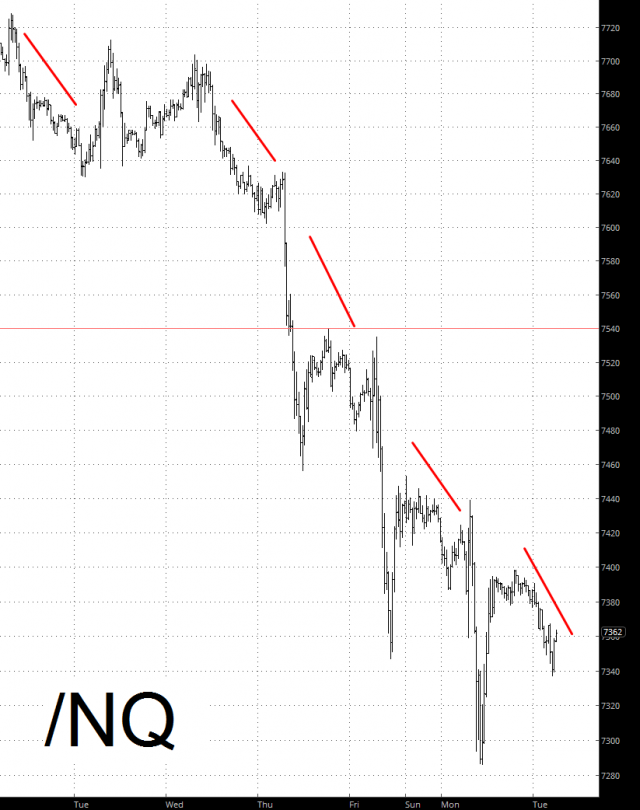
The tone of the market certainly seems to have changed recently. The VIX managed to traverse from about 11 to nearly 17 within a matter of days, and some sectors, particularly in technology, are finally beginning to take on some meaningful damage. One glance at the intraday NQ tells the tale.

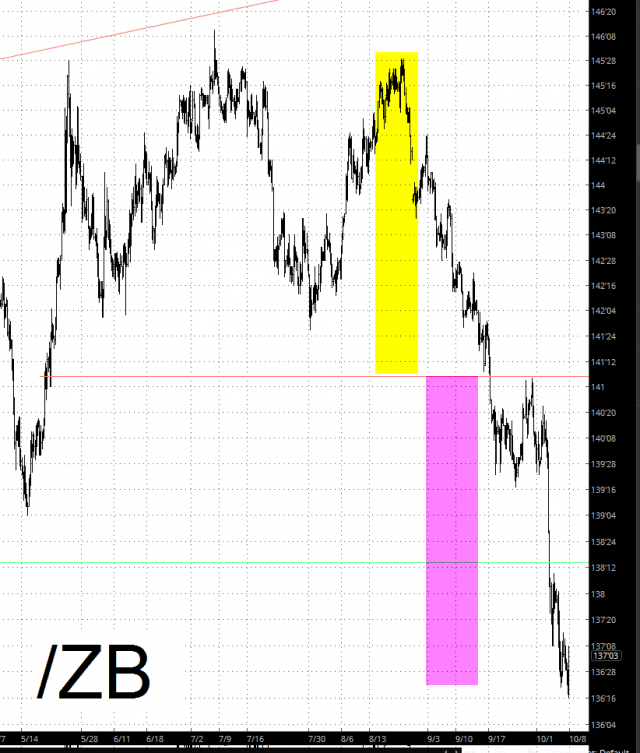
This entire year, I’ve spent more time fretting over bonds than I have over the likes of the ES and NQ. The bonds, represented below by the ZB chart, are at a very interesting point. First of all, they have absolutely perfectly made the measured move that I hypothetically charted out several weeks ago for my Gold and Diamond members. The height of the topping pattern almost precisely equals the depth of the down-move thus far.

It’s the “thus far” that I’m worried about. Do we commence a strong rally at this point in bonds, reliving interest rate pressure on equities and giving the bulls a brief break? Or are bonds in such dire straits that they simply keep crashing lower from here?
Even a Diamond membership can’t answer that question. The chartist in me is inclined to believe that bonds are “due” for a relief rally, perhaps to a little higher than 139. Long-term, I’m barely concerned, as I think bonds are destined by much substantially lower than they are now.
To maintain what’s left of my sanity, I continue to do what I’ve always done: focus on a large quantity of small, carefully-chosen positions whose stops are the decision point for each and every one. That way I don’t really need to embrace a specific short-term direction and instead let the components of the body take care of the body as a whole.
On a separate note, I want you to know we’ve got a pretty cool feature upgrade to announce in SlopeCharts, so I’ll be doing a post about that once the market closes today.
