A weekly excerpt from the Macro Review analysis sent to subscribers on 10 markets and two timeframes.
Last week’s review of the macro market indicators suggested, heading into the last full week before the Holiday season and November Options Expiration, sees the equity markets continued to look better on the longer timeframe than on the daily. Elsewhere looked for Gold (SPDR Gold Trust (ARCA:GLD)) to continue the bounce in its downtrend while Crude Oil (USO) headed lower. The US Dollar Index (UUP) looked to continue to move sideways with a chance of a pullback while US Treasuries (iShares Barclays 20+ Year Treasury (ARCA:TLT)) were level in their pullback.
The Shanghai Composite (SSEC) might consolidate in the uptrend while Emerging Markets (iShares MSCI Emerging Markets (ARCA:EEM)) muddled along sideways with a slight upward bias. Volatility (iPath S&P 500 Vix Short Term Fut (ARCA:VXX)) looked to remain subdued keeping the bias higher for the equity index ETF’s SPDR S&P 500 (ARCA:SPY), iShares Russell 2000 Index (ARCA:IWM) and PowerShares QQQ (NASDAQ:QQQ). Their charts were not as firm in that regard though, with the IWM in consolidation mode short term and the SPY and QQQ stronger but also looked better in the longer timeframe.
The week played out with Gold pushing higher while Crude Oil probed new lows before bouncing Friday. The US Dollar continued sideways until a break higher Friday, while Treasuries had a similar week. The Shanghai Composite continued to consolidate while Emerging Markets held at the lows before a Friday bounce.
Volatility held in a tight range before finishing at a new low and the low of the week. The Equity Index ETF’s continued to show no signs of falling, with the weakest, the IWM moving sideways in its range while the SPY and QQQ crept higher. The SPY finishing the week at new all-time highs. What does this mean for the coming week? Lets look at some charts.
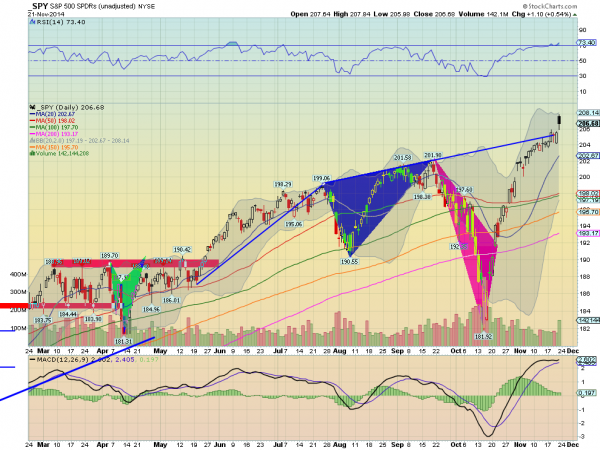
SPY Daily, SPY
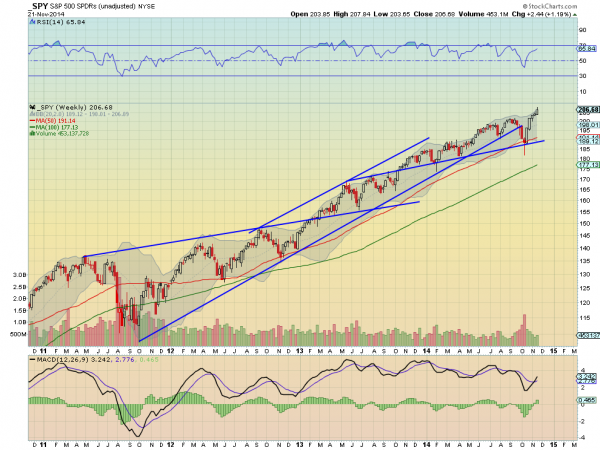
SPY Weekly, SPY
The SPY started the week looking like it was going to have trouble with the rising trend line, holding there after a small rise early in the week. Tuesday’s move higher looked promising until the Hanging Man candle Wednesday, but that was then negated by a bullish engulfing candle Thursday. The week closed out Friday technically confirming the bullish engulfing candle higher, but the Solid Black candle shows intraday weakness. A potential sign of topping. Seems more often than not the SPY continues to give mixed signals on the shorter timeframe.
The RSI on the daily chart is slightly in overbought territory but only just, not extreme, while the MACD is leveling, but at this point looks to be averting a cross down. On the weekly chart the picture is much clearer. After a series of candles that were smaller than the previous the week showed expansion as it moved higher. The RSI is rising and bullish and the MACD is continuing higher after crossing up. A bullish picture.
There is resistance at the Friday high at 207.84 and then free space above. The next levels to watch would be the Fibonacci extensions of 138.2%, 150% and 161.8% of the leg lower to the October bottom at 209.53, 211.89 and 214.25. Support lower may come at 205.70 and 204.80 followed by 203.25 and 201.90 before the round number at 200. Possible Short Term Pullback in the Uptrend.
Heading into the shortened Thanksgiving Holiday week the equity markets look solid longer term but a bit stretched in the short term. Elsewhere markets all are looking better to the upside. Look for Gold to continue the bounce higher while Crude Oil may join it as it is also biased to the upside short term. The US Dollar Index looks ready to resume its uptrend while US Treasuries round out of a short term pullback and continue up as well.
The Shanghai Composite looks to continue its uptrend and Emerging Markets may also be reversing higher. Volatility looks to remain subdued keeping the bias higher for the equity index ETF’s SPY, IWM and QQQ. Their charts continue to show divergence as the SPY and QQQ look higher in the intermediate term while the IWM continues sideways in a range. All three look at risk of a short term pullback this week, even if only Monday. Use this information as you prepare for the coming week and trad’em well.
