A weekly excerpt from the Macro Review analysis sent to subscribers on 10 markets and two timeframes.
Last week’s review of the macro market indicators noted that heading into the 4th Quarter the Equity markets looked strong with the PowerShares QQQ Trust Series 1 (NASDAQ:QQQ) leading the way.
Elsewhere we looked for gold (SPDR Gold Shares (NYSE:GLD)) to pullback short term while Crude Oil (United States Oil (NYSE:USO)) continued to the upside.
The US Dollar Index (DXY) looked to remain asleep moving sideways while US Treasuries (iShares 20+ Year Treasury Bond (NASDAQ:TLT)) were biased lower.
The Shanghai Composite (Deutsche X-trackers Harvest CSI 300 China A-Shares (NYSE:ASHR)) looked to continue the drift lower around 3000 while Emerging Markets (iShares MSCI Emerging Markets (NYSE:EEM)) consolidated.
Volatility (iPath S&P 500 VIX Short-Term Futures Exp 30 Jan 2019 (NYSE:VXX)) looked to remain subdued keeping the bias higher for the equity index ETF’s $SPY, $IWM and $QQQ. Their charts showed strength in the QQQ leading higher, with the SPY just behind and the IWM taking a breather, the weakest of the bunch.
The week played out with gold dropping lower before settling in at the end the week while crude oil kept marching higher. The US dollar woke up and moved slightly higher while Treasuries continued their breakdown. The Shanghai Composite took the week off, it was closed, while Emerging Markets continued their consolidation.
Volatility continued to hold at the lower end of the normal range. The Equity Index ETF’s did a whole lot of nothing, moving sideways in tight ranges. What does this mean for the coming week? Lets look at some charts.
SPDR S&P 500 (NYSE:SPY) Daily
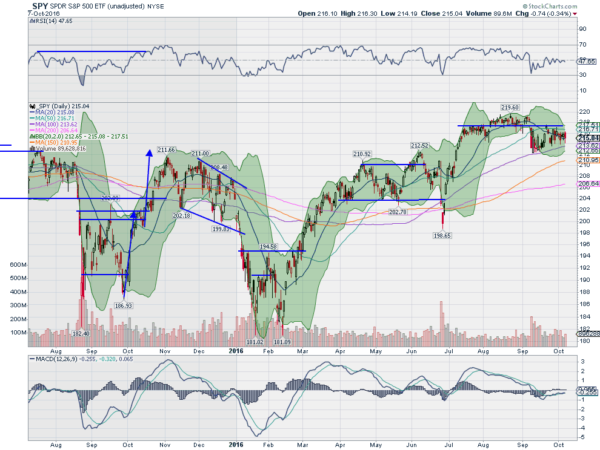
The SPY went into the week after a narrow range week that had drifted higher. And if you thought last week was a boring narrow range for the index ETF then this week must have been painful to sit through.
An even narrower range, from 213.99 to 216.30. Like watching paint dry. That is not unusual for a non-farm payroll report week, but the report date often then breaks the range. Not this time.
The daily chart shows this is happening under the 50 day SMA and the prior support area in August. The RSI on the daily chart is holding at the mid line, neither bullish nor bearish, with the MACD slowly moving higher.
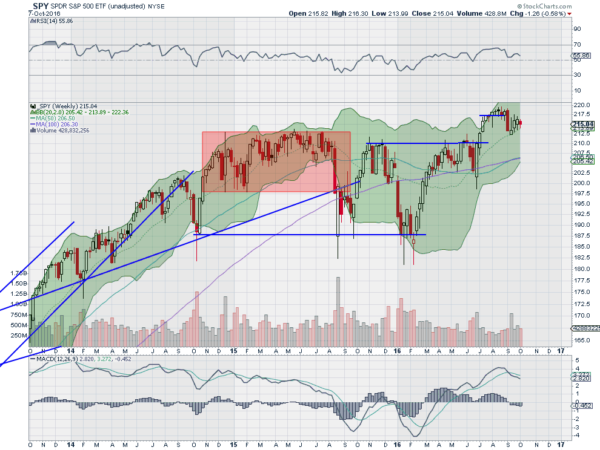
On the weekly chart the 20 week SMA has been acting as support the last 4 weeks. Each week has been an inside week, forming a triangle. A break would look for a 5 point move.
The RSI on this timeframe is falling but over the mid line and bullish, while the MACD is falling and crossed down, but positive. There is support at 215 and 214 followed by 212.50 and 210.20. Resistance above comes at 215.70 and 217 followed by 218 and 219 before 219.50. Consolidation in the Uptrend.
SPY Weekly
Heading into next week the equity index ETF’s look like they need a breather in the short term. Elsewhere look for gold to continue lower while crude oil continues to the upside. The US Dollar Index looks strong but range bound while US Treasuries are biased lower again. The Shanghai Composite is biased to the drift to the downside Emerging Markets look like they will continue to consolidate in the uptrend.
Volatility looks to remain in the lower end of the normal range keeping the bias higher for the equity index ETF’s SPY, IWM and QQQ. Their charts all look to continue consolidating in the short run with the QQQ looking the best for upside and the SPY next, with the IWM at risk for a pullback. Use this information as you prepare for the coming week and trad’em well.
DISCLAIMER: The information in this blog post represents my own opinions and does not contain a recommendation for any particular security or investment. I or my affiliates may hold positions or other interests in securities mentioned in the Blog, please see my Disclaimer page for my full disclaimer.
Which stock should you buy in your very next trade?
With valuations skyrocketing in 2024, many investors are uneasy putting more money into stocks. Unsure where to invest next? Get access to our proven portfolios and discover high-potential opportunities.
In 2024 alone, ProPicks AI identified 2 stocks that surged over 150%, 4 additional stocks that leaped over 30%, and 3 more that climbed over 25%. That's an impressive track record.
With portfolios tailored for Dow stocks, S&P stocks, Tech stocks, and Mid Cap stocks, you can explore various wealth-building strategies.
