Last week’s review of the macro market indicators noted as the books were closed on the 3rd Quarter, the equity markets were taking a breather after making recent new highs. Elsewhere looked for Gold (GLD (NYSE:GLD)) to continue lower in its downtrend while Crude Oil (USO (NYSE:USO)) drove higher. The US Dollar Index (DXY) was be ready to reverse higher while US Treasuries (iShares 20+ Year Treasury Bond (NASDAQ:TLT)) had bounced again at support and were now rising.
The Shanghai Composite (ASHR) was also building a possible reversal higher while Emerging Markets (EEM) continued to fall in a channel. Volatility (VXX) looked to remain very low keeping the bias higher for the equity index ETF’s SPY, IWM and QQQ. Their charts showed digestive behavior, with sideways or slight pullbacks on the longer timeframe. On the shorter timeframe there had been continued rotation, now into the Invesco QQQ Trust Series 1 (NASDAQ:QQQ) as the SPY (NYSE:SPY) paused with the iShares Russell 2000 (NYSE:IWM) still lagging.
The week played out with Gold finding support and pushing back higher early in the week while Crude Oil continued higher early but saw late week profit taking. The US Dollar made a higher high and then paused while Treasuries continued their move to the downside. The Shanghai Composite was closed for the week while Emerging Markets dropped back to the September lows.
Volatility crept up to the mid teens late in the week, making the environment less friendly for equities. The Equity Index ETF’s reacted continued their path early in the week with the SPY and QQQ holding in a range while the IWM continued lower. But the SPY and QQQ followed the IWM lower late in the week. What does this mean for the coming week? Lets look at some charts.
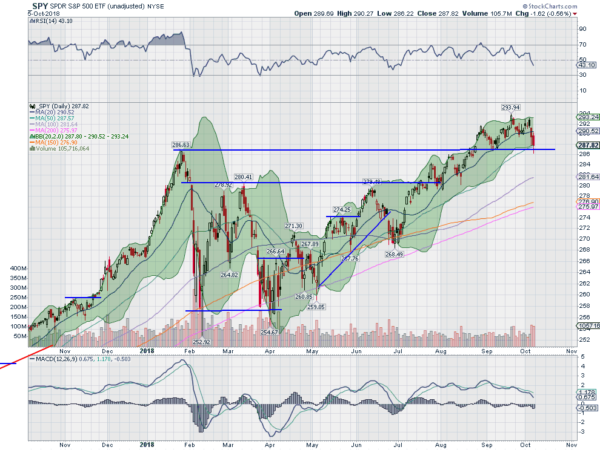
The SPY had pulled back to its 20 day SMA and was sitting there when the week began. It moved back up off of it Monday and held there through Wednesday with small body candles. Thursday it started to move lower and continued Friday. The low was at a retest of the January highs and it bounced there to end back over the 50 day SMA.
The daily chart shows the RSI making a 3 month low as it falls. It is still in the bullish zone though. The MACD is also falling, but still positive, so bullish. The fall stopped Friday at the lower Bollinger Band® as well. A bad week but no real damage ion this timeframe, more like giving up the clear renewal of an uptrend.
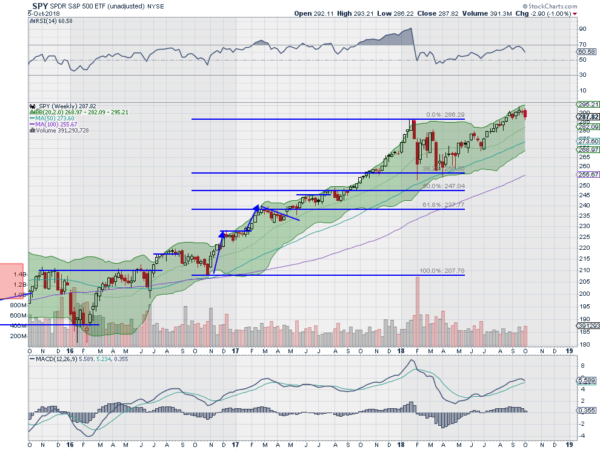
On the weekly chart it printed a bearish engulfing candle. But it was a pretty small range not a driving lower and looks more like a sideways consolidation. The RSI is pulling back in the bullish zone with the MACD about to cross down but strongly positive. There is support lower at 287.50 and 286 then 284 and 281. Resistance higher comes at 290 and 291 then 294. Consolidation in the Uptrend.
After one week of October the equity markets have given up strength with some sectors bleeding red in the shorter frame while holding key levels on the longer timeframe. Elsewhere look for Gold to consolidate in the downtrend while Crude Oil pauses in its move higher. The US Dollar Index is moving higher in consolidation while US Treasuries are trending lower. The Shanghai Composite comes back from vacation looking like a possible reversal to the upside but Emerging Markets resumed their downtrend.
Volatility perked up and may continue, making it more difficult for the equity index ETF’s SPY, IWM and QQQ. The IWM is in full blow short term downtrend but at support on the longer timeframe. The QQQ are consolidating on the longer timeframe but also leaking in the shorter view. The SPY looks the strongest on that longer timeframe but is also dipping to retest the January highs in the short run. Use this information as you prepare for the coming week and trad’em well.
The information in this blog post represents my own opinions and does not contain a recommendation for any particular security or investment. I or my affiliates may hold positions or other interests in securities mentioned in the Blog, please see my Disclaimer page for my full disclaimer.


