Last week’s review of the macro market indicators suggested heading into October Options Expiration week that the equity markets were looking stronger, but had not sent the all clear signal yet.
Elsewhere looked for gold (N:GLD) to continue its short term uptrend, while crude oil (N:USO) did the same but might encounter resistance. The US dollar index (N:UUP) had a short term bias lower for the week in the broad consolidation, while US Treasuries (N:TLT) were biased lower short term as well. The Shanghai Composite (N:ASHR) looked to continue in consolidation, while Emerging Markets (N:EEM) were biased to the upside.
Volatility (N:VXX) looked to return to more normal levels relieving the downward bias on the equity index ETFs N:SPY, N:IWM and O:QQQ. Their charts all showed strength continuing into the week, but with the SPY the strongest followed by the QQQ and then the IWM on the longer term look.
The week played out with gold pushing higher, while crude oil found resistance but rebounded late in the week. The US dollar moved lower while Treasuries found support and bounced. The Shanghai Composite started higher out of consolidation, while Emerging Markets dipped and bounced finishing almost unchanged.
Volatility settled and ended with a dip to 2 month lows. The Equity Index ETFs started the week looking like they would roll over again only to find support and push back higher, with all but the IWM ending the week positive. What does this mean for the coming week? Lets look at some charts.
SPY Daily
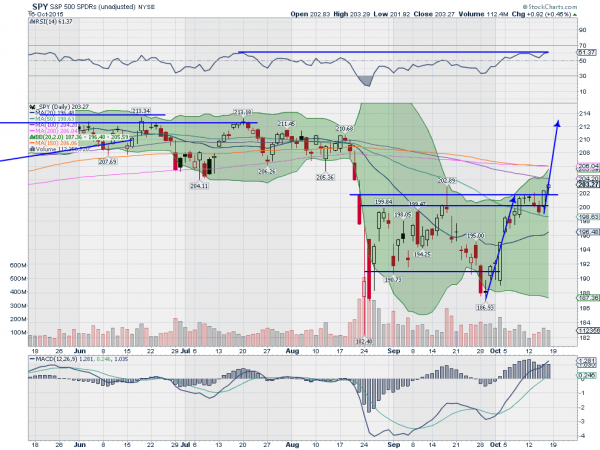
The SPY opened the week over the short term support in place since the August plunge, and printed a second doji candle, unable to break the August 21st open level. It pulled back from the double doji under support and to the 50 day SMA Wednesday before a bounce, declaring the pullback a bull flag.
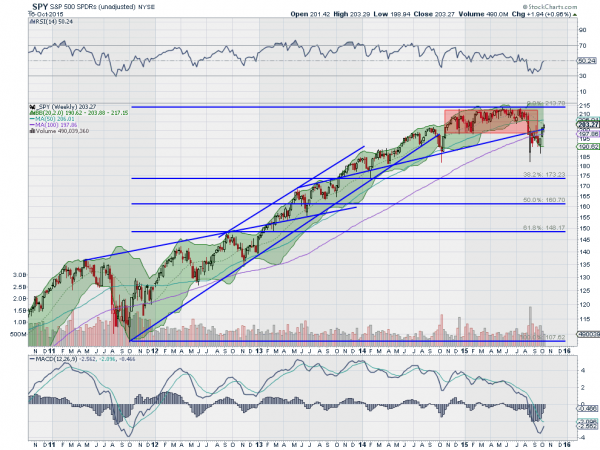
It then ran higher Thursday and Friday ending at a nearly 2 month closing high. The Measured Move would take the SPY back to the all-time high level. The daily chart shows the RSI is back into the bullish zone with the MACD rising. The next crucial area will be the flat SMA’s overhead. On the weekly chart, the move puts the SPY over the prior trend support.
It has a RSI on this timeframe that is rising through the mid line with the MACD turned up and heading for a cross. There is resistance higher at 204.40, followed by 206.40 and 208.40. Support lower comes at 201.75 and 200 before 199.50 and 198. Continued Short Term Uptrend.
SPY Weekly
With October Options Expiration behind, the Equity Markets are looking stronger. Elsewhere look for gold to pullback in the short term in its uptrend, while crude oil rises. The US dollar index is biased lower in consolidation, while US Treasuries have a short term bias higher in their consolidation. The Shanghai Composite and Emerging Markets are biased to the upside with risk of the Emerging Markets hitting long term resistance.
Volatility is back to the normal range and falling, putting the bias higher for the equity index ETFs SPY, IWM and QQQ. After strong back halves of the week, the SPY and QQQ look as if they may be ready to reverse the downward August trend and resume higher, while the IWM remains in a consolidation zone. Use this information as you prepare for the coming week and trad’em well.
Disclaimer: The information in this blog post represents my own opinions and does not contain a recommendation for any particular security or investment. I or my affiliates may hold positions or other interests in securities mentioned in the Blog. Please see my Disclaimer page for my full disclaimer.
