Last week’s review of the macro market indicators noted heading into the week the SPY (NYSE:SPY) and iShares Russell 2000 (NYSE:IWM) looked ready to hand over the lead to the QQQ as they took a breather after strong runs. Elsewhere looked for Gold to continue lower while Crude Oil ($USO) also moved to the downside. The US Dollar Index looked better to the upside short term while US Treasuries ($TLT) were biased lower.
The Shanghai Composite ($ASHR) and Emerging Markets ($EEM) were biased to the upside for the week. Volatility (iPath S&P 500 VIX Short-Term Futures Exp 30 Jan 2019 (NYSE:VXX)) looked to remain very low keeping the bias higher for the equity index ETF’s SPY, IWM and QQQ. Their charts all looked great on the longer timeframe, while the SPY and IWM were extended in the shorter timeframe and could pause or pullback slightly.
The week played out with Gold once again bucking the trend and reversing higher while Crude Oil started the week at the recent lows but also reversed. The US Dollar ended its run, a Dead Cat Bounce and turned lower while Treasuries turned to the upside and moved higher. So basically completely wrong so far. The Shanghai Composite broke that trend by continuing higher toward the next round number and Emerging Markets rose to a 7 year high.
Volatility spent another week in a very tight range near all-time lows, keeping the bias higher for equities. The Equity Index ETF’s held in tight ranges on the week, printing small range daily changes, with the SPY and QQQ pushing up to new all-time highs and the IWM continuing to consolidate its run higher, moving sideways. What does this mean for the coming week? Lets look at some charts.
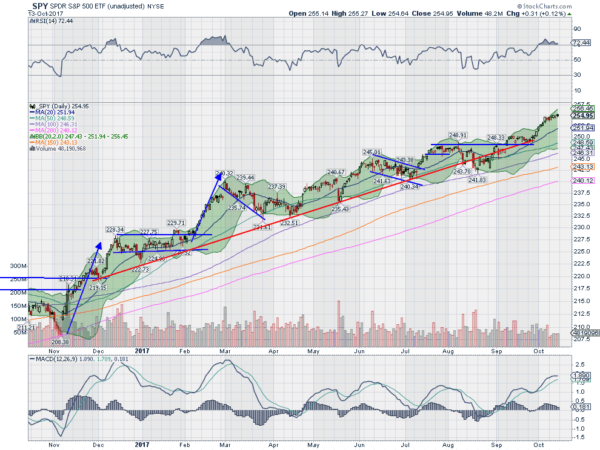
The SPY came into the week pennies off of its record high close Thursday following the 8 day run up. Some consolidation was not unexpected. Monday saw more and then Tuesday it started to drift higher, continuing the rest of the week. It was a week of narrow range days, specifically 4 narrower days in a row to end the week, but ending at a new all-time high. It also ended back within the Bollinger Bands®.
The daily chart shows the RSI running a bit hot, high in the bullish zone and technically overbought. But it is moving sideways, not reaching up to extremes. The MACD is also in bullish territory and benignly moving sideways. A target on a Measured Move now stands at 260. Nothing overheated here.
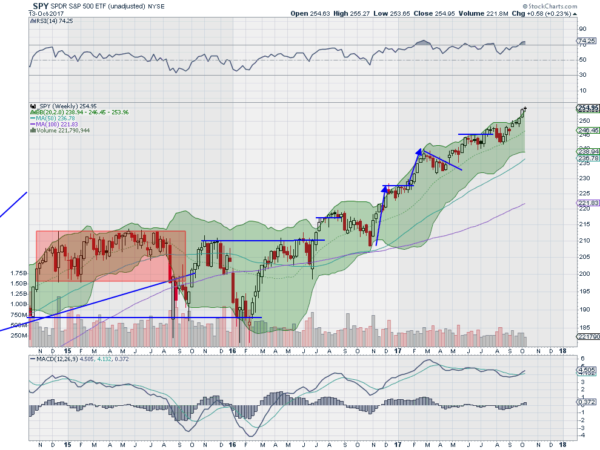
On the longer weekly chart the doji after the run higher from the 20 week SMA suggests more consolidation or a pullback is needed before further upside. The RSI is also a bit overbought but not extreme while the MACD is crossed up and rising. There is no resistance over 255. Support lower sits at 253.50 and 250 followed by 248 and 246. Possible Consolidation in the Uptrend.
Heading into October Options Expiration the equity markets are all at record highs and looking strong. Elsewhere look for Gold to continue higher in the short term while Crude Oil also slowly grinds its way up. The US Dollar Index may be pausing in the longer downtrend while US Treasuries are strong and rising short term. The Shanghai Composite and Emerging Markets both look to continue to move higher in slow fashion.
Volatility looks to remain at very low levels keeping the bias higher for the equity index ETF’s SPY, IWM and QQQ. Their charts agree completely on the longer timeframe. And all 3 look good on the shorter timeframe with the QQQ benefiting from short term consolidation in the IWM. Use this information as you prepare for the coming week and trad’em well
The information in this blog post represents my own opinions and does not contain a recommendation for any particular security or investment. I or my affiliates may hold positions or other interests in securities mentioned in the Blog, please see my Disclaimer page for my full disclaimer.


