A weekly excerpt from the Macro Review analysis sent to subscribers on 10 markets and two timeframes.
Last week’s review of the macro market indicators noted that heading into the last week of September the Equity Indexes were looking strong, especially on the longer timeframe. Elsewhere looked for gold to move higher short term in consolidation while Crude Oil consolidated. The US Dollar Index also looked to continue to move sideways while iShares 20+ Year Treasury Bond (NASDAQ:TLT) were biased higher.
The Shanghai Composite looked to drift higher while iShares MSCI Emerging Markets (NYSE:EEM) were biased to the downside in the short term. iPath S&P 500 VIX Short-Term Futures Exp 30 Jan 2019 (NYSE:VXX) looked to remain at abnormally low levels keeping the bias higher for the equity index ETF’s SPDR S&P 500 (NYSE:SPY), iShares Russell 2000 (NYSE:IWM) and PowerShares QQQ Trust Series 1 (NASDAQ:QQQ). Their charts showed strength in moving higher at the end of the week, especially in the longer timeframe.
The week played out with Gold finding resistance, stalling the move and sending it lower while Crude Oil broke consolidation late in the week and headed higher. The US Dollar stayed the course in a very tight range while Treasuries moved higher but gave a lot of the move back Friday. The Shanghai Composite continued its mostly sideways around 3000 while Emerging Markets started lower but held in a tight range.
Volatility moved up off of the low but stalled at the moving averages and fell back to end little changed. The Equity Index ETF’s all gapped lower to start the week, but hen slowly moved higher to recover. The SPY (NYSE:SPY) and QQQ ended the week positive while the IWM lagged them finishing near unchanged. What does this mean for the coming week? Lets look at some charts.
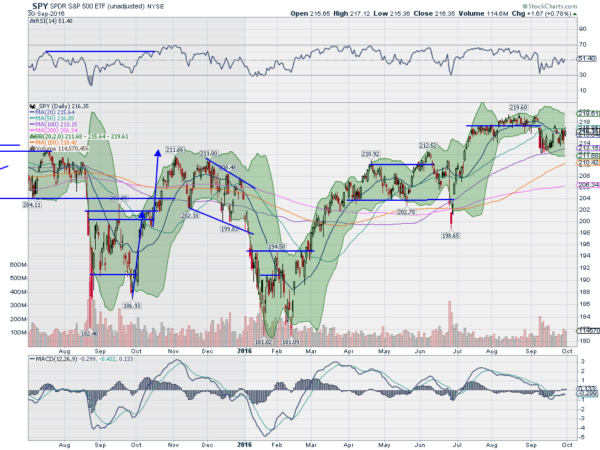
SPY Daily
The SPY started the week with a gap down below its 20 and 50 day SMA’s. Tuesday saw a bullish engulfing candle though, a possible reversal candle, move back over the 20 day SMA, and confirmation with an up day Wednesday. Thursday give back those gains though and fell back below the 20 day SMA before another push higher Friday.
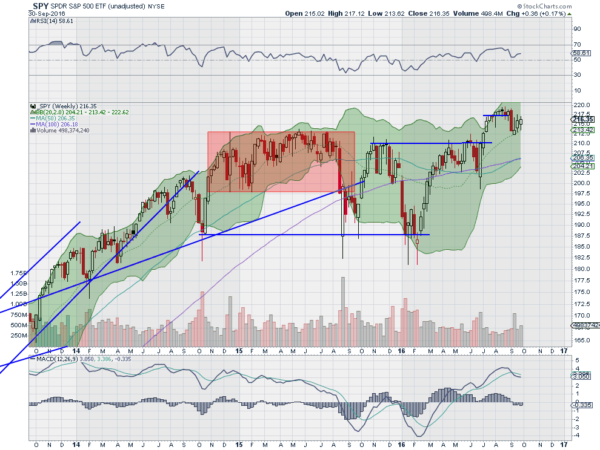
In the end the SPY ended the week little changed and at the 50 day SMA, just under the August support level, acting as resistance now. The daily chart shows a RSI oscillating around the mid line with the MACD slowly rising. On the longer weekly timeframe the chart printed an up week, the third weekly higher close in a row, after a touch at the 20 week SMA. The RSI on this timeframe made a higher low and is now moving higher and bullish. The MACD is falling but stalling in the drop and leveling.
It looks like nothing more than a retest of the 2015 all-time high resistance zone and a bounce. There is resistance at 217 and 218 followed by 219 and 219.60. Support lower comes at 215.70 and 215 followed by 214 and 212.50 then 210.20. Upward Price Action.
SPY Weekly

Heading into the 4th Quarter the Equity markets look strong with the QQQ leading the way. Elsewhere look for Gold to pullback short term while Crude Oil continues to the upside. The US Dollar Index looks to remain asleep moving sideways while US Treasuries are biased lower. The Shanghai Composite looks to continue the drift lower around 3000 while Emerging Markets consolidate.
Volatility looks to remain subdued keeping the bias higher for the equity index ETF’s SPY, IWM and QQQ. Their charts show strength in the QQQ leading higher, with the SPY just behind and the IWM taking a breather, the weakest of the bunch. Use this information as you prepare for the coming week and trad’em well.
The information in this blog post represents my own opinions and does not contain a recommendation for any particular security or investment. I or my affiliates may hold positions or other interests in securities mentioned in the Blog, please see my Disclaimer page for my full disclaimer.

