Last week’s review of the macro market indicators noted that heading into the last week full week before the election the equity markets continued to look troubled on the short timeframe, with the weakness starting to leak into the longer timeframe for the small caps. Elsewhere looked for gold to drift higher while crude oil continued the short term move lower. The US Dollar Index looked ready for consolidation or a pullback short term while US Treasuries (NASDAQ:TLT) were biased lower.
The Shanghai Composite looked to continue to drift higher as Emerging Markets (NYSE:EEM) were biased to the downside in consolidation. Volatility (NYSE:VXX) looked to remain in the normal range but creeping up, adding a headwind for the equity index (NYSE:SPY), (NYSE:IWM) and (NASDAQ:QQQ). Their charts also showed short term weakness with the IWM the weakest as it fell and the SPY next but the QQQ holding near all-time highs.
The week played out with gold pushing higher and finding resistance at prior support while crude oil did continue lower all week. The US dollar skipped the consolidation and pulled back all week while Treasuries found support and held, perhaps a short term bottom. The Shanghai Composite drifted slightly higher while Emerging Markets moved lower, to the bottom of their recent range.
Volatility did creep higher ending, just pushing over the top of acceptable ranges. The Equity Index ETF’s all started the week moving lower extending the short term weakness. Friday saw a slight bounce that may signal a bottom being built. Next week may tell, if it is a short term short covering or a real bottom. What does this mean for the coming week? Lets look at some charts.
SPY Daily
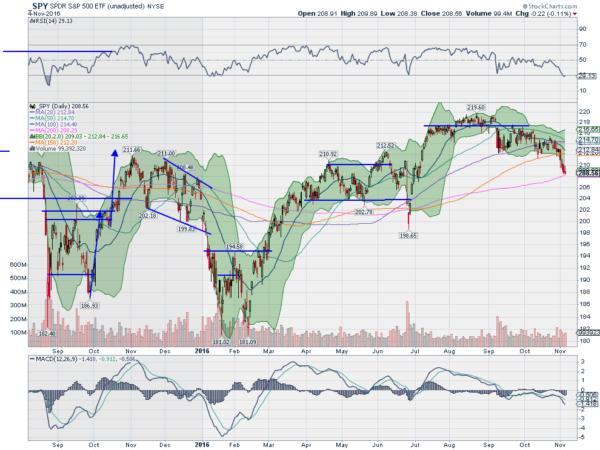
The SPY came into the week after moving lower, but finding support at the area that had been in place since September. Monday saw an inside day, a Harami, that can often signal a reversal. But there was no reversal as Tuesday saw a strong move lower and then a partial recovery to the edge of the Bollinger Bands®. It followed lower the rest of the week finishing just above its 200 day SMA.
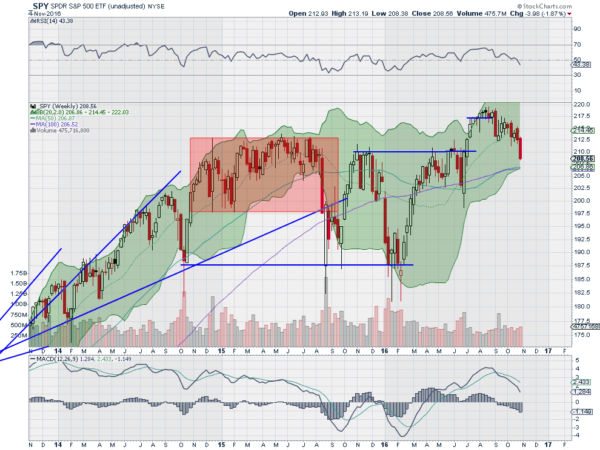
The RSI on the daily chart has pierced into technically oversold territory, but no where near extreme levels. It can go lower. The MACD continued lower and is negative. On the weekly chart it nearly printed a bearish Marubozu candle, opening near the high and closing near the low of the week.
The RSI on this timeframe fell through the mid line, but remaining in the bullish zone, while the MACD is falling, but still positive. There is support lower at 207.50 and 205.70 followed by 204 and 202. Resistance higher comes at 209 and 210.20 followed by 212.50 and 214. Continued Short Term Downside.
SPY Weekly
Heading into the first full week of November and with the US elections Tuesday, the equity markets are weak and hemorrhaging. Elsewhere, look for gold to continue higher in the short term while crude oil continues to move lower. The US dollar index looks to continue to the downside, while US Treasuries are biased lower but consolidating.
The Shanghai Composite should continue to drift higher while Emerging Markets are biased to the downside. Volatility looks to remain elevated keeping the bias lower for the equity index ETF’s SPY, IWM and QQQ. Their charts agree and look better to the downside on both the daily and weekly timeframes. Use this information as you prepare for the coming week and trad’em well.
The information in this blog post represents my own opinions and does not contain a recommendation for any particular security or investment. I or my affiliates may hold positions or other interests in securities mentioned in the Blog, please see my Disclaimer page for my full disclaimer.
