Last week’s review of the macro market indicators noted that with the election in the rearview mirror and heading into the last full week before Thanksgiving and the holiday season begins, equity markets were looking a bit mixed but positive. Elsewhere looked for Gold to continue lower while Crude Oil moved lower in the short term as well. The US Dollar Index looked strong and ready to challenge the 2015 highs while US Treasuries were biased to continue lower.
The Shanghai Composite was looking strong as it continued higher while iShares MSCI Emerging Markets (NYSE:EEM) were at key support and looking weak if that did not hold. iPath S&P 500 VIX Short-Term Futures Exp 30 Jan 2019 (NYSE:VXX) looked to remain at the lower end of normal levels now that the election had passed keeping the bias higher for the equity index ETF’s SPDR S&P 500 (NYSE:SPY), iShares Russell 2000 (NYSE:IWM) and PowerShares QQQ Trust Series 1 (NASDAQ:QQQ). Their charts were a bit mixed though with the IWM leading a charge higher towards new all-time highs while the SPY (NYSE:SPY) stalled just below highs and the QQQ struggled in consolidation.
The week played out with gold holding steady at support until it pushed lower to end the week while Crude Oil started lower but found support and ran higher later in the week. The US Dollar continued its run higher while Treasuries found found support and moved in a narrow range. The Shanghai Composite continued the drift higher while Emerging Markets held support in a very tight range for the week.
Volatility held at the lows of the prior week and drifted down slightly. The Equity Index ETF’s shifted a bit though with the SPY and QQQ now following the IWM higher. The IWM ended the week with a string of new all-time high closes. The SPY rose within 1% of its all-time high and the QQQ was less than 2 points away from its prior top. What does this mean for the coming week? Lets look at some charts.
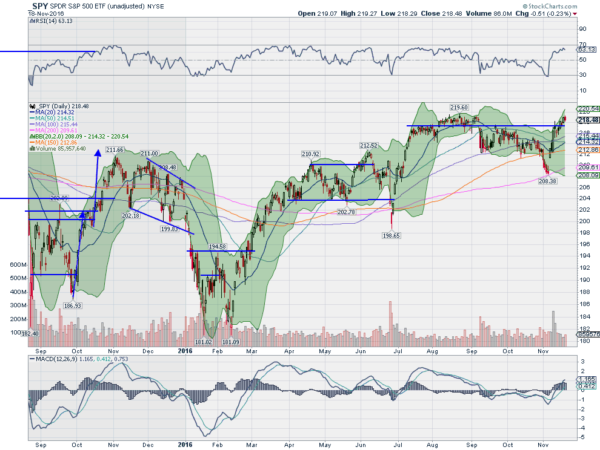
SPY Daily

The SPY started the week at resistance that had been in place since September and a level that had shown to be significant since the beginning of July. Monday printed a small body candle under resistance, but Tuesday saw it push through to the upside. Consolidation Wednesday was then followed by another push higher and another inside day Friday, holding over that prior resistance. The daily chart shows the RSI pushed into the bullish zone and the MACD is bullish and rising, both supporting further movement to the upside.
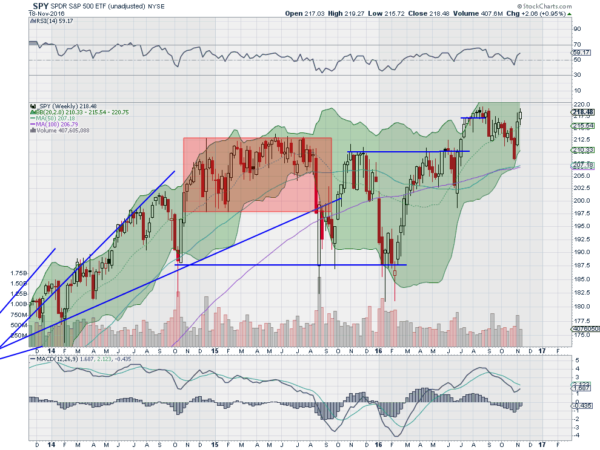
The weekly chart shows the intraday action pressed up within a few cents of the intraday highs before a slight pullback. The RSI is rising and bullish though with the MACD turned up and about to cross up. There is resistance at 219 and 219.60 and then free air to move higher. There is a Positive RSI Reversal target to about 229 above. Support lower comes at 218 and 217 followed by 215.70 and 214. Continued Upward Price Action.
SPY Weekly

With November Options Expiration behind and heading into the shortened Thanksgiving holiday week, equity markets look strong. Elsewhere look for Gold to continue lower while Crude Oil moves to the upside in the short run. The US Dollar Index remains strong as it moves higher while US Treasuries continue to be biased lower. The Shanghai Composite looks to continue to drift higher and Emerging Markets may have found support in their move lower.
Volatility looks to remain at unusually low levels keeping the bias higher for the equity index ETF’s SPY, IWM and QQQ. Their charts show strength in the IWM and SPY both short term and in the intermediate time frame. The QQQ however remains stuck in consolidation in the longer timeframe. Use this information as you prepare for the coming week and trad’em well.
The information in this blog post represents my own opinions and does not contain a recommendation for any particular security or investment. I or my affiliates may hold positions or other interests in securities mentioned in the Blog, please see my Disclaimer page for my full disclaimer.
