Last week’s review of the macro market indicators suggested, heading into May that the equity markets continued to look better on the longer timeframe but a bit shakier on the shorter timeframe.
Elsewhere looked for gold (via ARCA:GLD) to consolidate with a downward bias while crude oil (via NYSE:USO) continued higher. The US Dollar Index (via NYSE:UUP) had pulled back to a critical level where a reversal could be expected but more downside indicating a character change while US Treasuries (via ARCA:TLT) continued to be biased lower. The Shanghai Composite (via NYSE:ASHR) might finally be consolidating in its uptrend while Emerging Markets (via ARCA:EEM) were showing some downside risk due to a wider consolidation.
Volatility (via ARCA:VXX) looked to remain subdued keeping the bias higher for the equity index ETF’s ARCA:SPY, ARCA:IWM and NASDAQ:QQQ. Their charts looked a bit vulnerable in the short term despite the support and moves higher Friday, with the IWM the weakest and the SPY and QQQ in consolidation zones. The QQQ chart looked the best on the longer timeframe.
The week played out with gold pushing higher initially in a bear flag before falling back while crude oil started higher but met resistance and pulled back to about even on the week. The US dollar moved slightly higher early but also reversed ending lower on the week while Treasuries made a lower low before a slight bounce. The Shanghai Composite pulled back all week into it found a bid Friday while Emerging Markets moved similarly.
Volatility spiked up through its SMA’s but fell back by week’s end. The Equity Index ETF’s started the week and their highs and then immediately moved lower. But all recovered well Friday with the SPY and the IWM making up all of the downturn and the QQQ the recovering most of it. What does this mean for the coming week? Lets look at some charts.
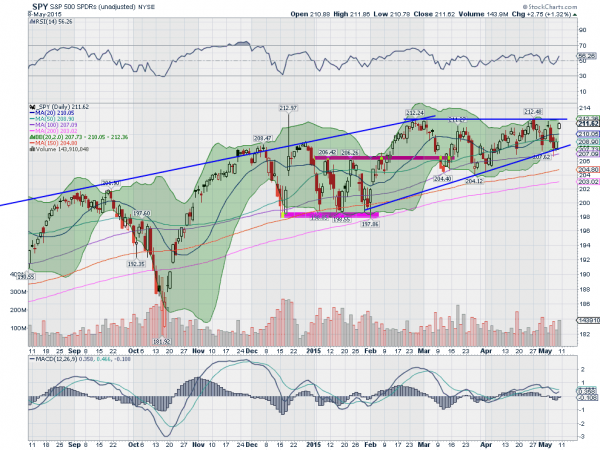
SPY Daily, SPY
The SPY started the week jumping higher, but quickly showed signs of failure. The Shooting Star candle Monday was confirmed lower Tuesday and followed through Wednesday, down to the lower Bollinger Band®, rising trend support and a touch at the 100 day SMA. Surprise, surprise, they held again on Thursday and gapped up Friday, ending the week positive. There has been an ascending triangle building since late February.
It has tightened to the sweet spot, about two thirds of the way through, where the strongest resolutions happen. A break higher would target a move to 220 on a conservative measure. The daily chart shows the RSI running along the mid line in the bullish zone, while the MACD is trying to cross up. Those Bollinger Bands are also getting tighter.
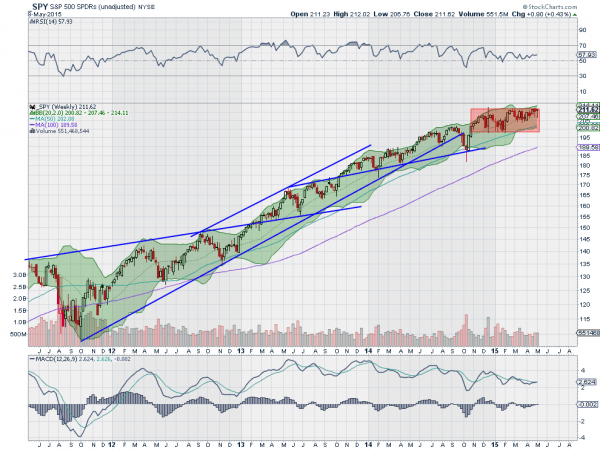
On the weekly chart the consolidation box at the highs continues to hold. The Hanging Man candle will have some looking for a reversal lower, but I would not put a lot of faith in that with the consolidation leading into it. The RSI on this timeframe is in the bullish zone as well and the MACD crossing up, with the Bollinger Bands turning higher. There is resistance from 212 to 212.50 and then free air. Support lower comes at 211 and 210.25 followed by 209 and 208. Consolidation in the Uptrend with an Upward Bias.
SPY Weekly, SPY
Heading into the May Options Expiration week the equity markets look to have weathered a storm, or at least most of one. Elsewhere look for gold to continue to move sideways near 1200 while crude oil pulls back in its new uptrend. The US Dollar Index still looks weak while US Treasuries remain biased lower. The Shanghai Composite looks to continue to pullback in its uptrend and Emerging Markets are biased to the downside.
Volatility looks to remain subdued keeping the bias higher for the equity index ETF’s SPY, IWM and QQQ, despite the ruckus this week. Their charts all continue to look better on the longer timeframe with the SPY and QQQ looking more sideways in the short run while the IWM may take another leg lower. Use this information as you prepare for the coming week and trad’em well.
