Last week’s review of the macro market indicators suggested, heading into the last week of April, that the equity indexes were looking strong on the weekly timeframes and a bit mixed on the short term view.
Elsewhere looked for Gold ARCA:GLD to continue lower while Crude Oil NYSE:USO rose towards a major character change area. The US Dollar Index NYSE:UUP looked to continue to consolidate the large move higher while US Treasuries ARCA:TLT were biased lower in the short term in their uptrend. The Shanghai Composite NYSE:ASHR and Emerging Markets ARCA:EEM were biased to the upside with risk of the Chinese market becoming overheated at any point.
Volatility ARCA:VXX looked to remain subdued keeping the bias higher for the equity index ETF’s ARCA:SPY, ARCA:IWM and NASDAQ:QQQ. Their charts all looked higher on the weekly timeframe but on the daily timeframe the QQQ was a bit stretched while the IWM and SPY tested resistance but with some strength.
The week played out with Gold pushing higher before falling back to end the week down while Crude Oil moved above that change of character area and settled higher. The US Dollar moved lower but may have found support Friday while Treasuries continued lower. The Shanghai Composite broke another barrier and the consolidated sideways while Emerging Markets pulled back to support.
Volatility poked its head higher briefly before pulling back. The Equity Index ETF’s all pulled back hard with the IWM taking the brunt of the downturn, but all bounced a bit Friday. Perhaps a bounce in place? What does this mean for the coming week? Lets look at some charts.
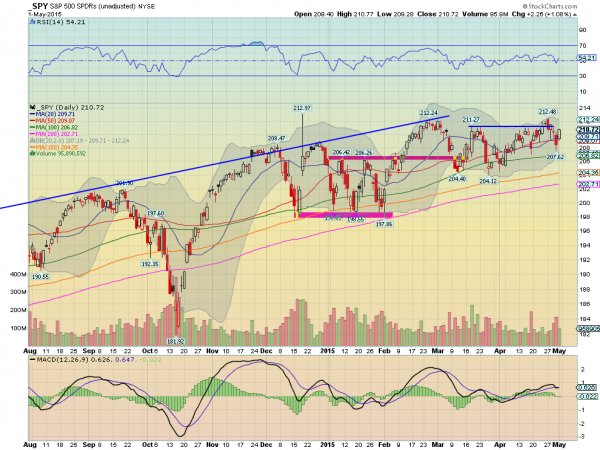
SPY Daily, SPY
The SPY started the week moving higher only to finish Monday with a bearish engulfing candle. The price action continued lower through Thursday before reversing higher Friday. The Marubozu candle Friday bodes for more upside, finishing on the high. It also made a higher low short term in the process. Positive action in the end. The RSI on the daily chart turned back higher, making for a Positive RSI Reversal that targets 213.09. The MACD on this timeframe also avoided a cross down.
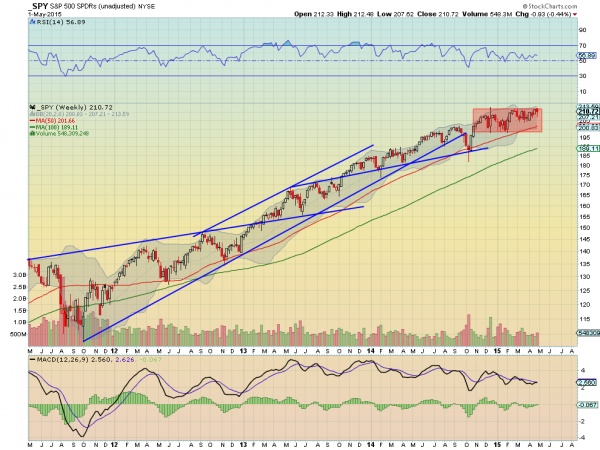
Out on the weekly chart price tapped the top of the consolidation box from October before pulling back. The RSI on this timeframe remains in the bullish zone while the MACD is about to cross up, a bullish signal. There is resistance at 211 and 212.25 to 212.48 before free air above and a Measured Move to 221. Support lower comes at 210.25 and 209 before 208 and 206.40. Consolidation in the Long Term Uptrend.
SPY Weekly, SPY
Heading into May the equity markets continue to look better on the longer timeframe but a bit shakier on the shorter timeframe. Elsewhere look for Gold to consolidate with a downward bias while Crude Oil continues higher. The US Dollar Index has pulled back to a critical level where a reversal could be expected but more downside a character change while US Treasuries continue to be biased lower. The Shanghai Composite may finally be consolidating in its uptrend while Emerging Markets are showing some downside risk due to a wider consolidation.
Volatility looks to remain subdued keeping the bias higher for the equity index ETF’s SPY, IWM and QQQ. Their charts look a bit vulnerable in the short term despite the support and moves higher Friday, with the IWM the weakest and the SPY and QQQ in consolidation zones. The QQQ chart looks the best on the longer timeframe. Use this information as you prepare for the coming week and trad’em well.
DISCLAIMER The information in this blog post represents my own opinions and does not contain a recommendation for any particular security or investment. I or my affiliates may hold positions or other interests in securities mentioned in the Blog, please see my Disclaimer page for my full disclaimer.
