Last week’s review of the macro market indicators saw equities continuing to look better to the downside short term after a week lower, but with a glimpse of promise from the Friday action.
Elsewhere looked for gold to resume its uptrend while crude oil moved higher as well. The US dollar index was set to continue the bounce, while US Treasuries (NYSE:TLT) consolidated with an upward bias.
The Shanghai Composite continued to consolidate with a bias lower, and Emerging Markets (NYSE:EEM) were biased to the downside. Volatility (NYSE:VXX) looked to remain subdued, keeping the bias higher for the equity index ETFs SPDR S&P 500 (NYSE:SPY), iShares IWM Russell 2000 (NYSE:IWM) and PowerShares QQQ Trust Series 1 (NASDAQ:QQQ), despite their moves lower.
Their charts suggested more short term downside though, with the QQQ looking the worst.
The week played out with gold drifting lower, not far from last week’s close, while crude oil started lower but rebounded to end the week up. The US dollar moved slightly higher to resistance then higher again to end the week, while treasuries pushed higher Friday after a flat week.
The Shanghai Composite fell out of consolidation early and then stabilized, moving sideways, while Emerging Markets consolidated before a push lower Friday.
Volatility remained in the normal range, uneventful. The Equity Index ETFs started the week moving higher, but gave it all back by Friday, ending the week nearly flat to down. The IWM was the worst of them with the SPY and the QQQ giving up the least.
What does this mean for the coming week? Lets look at some charts.
SPY Daily
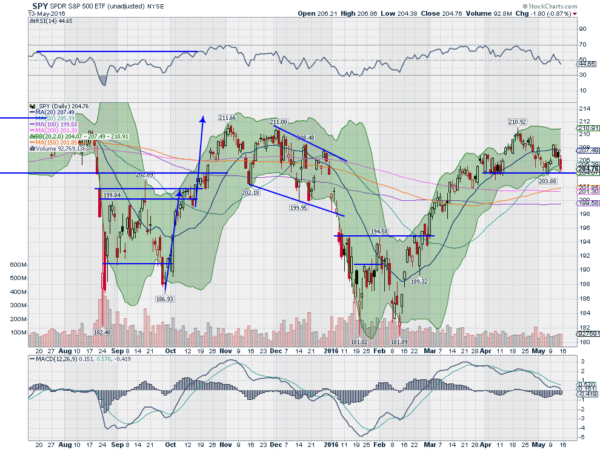
The SPY started the week with a small move up, confirming the reversal of the prior two down weeks. It continued with a gap up Tuesday, over the 20 day SMA, but then started back lower Wednesday. By Friday it had filled the gap and was lower on the week, and back near support. The daily chart shows the RSI making a lower low, back through the mid line from above, and the MACD continuing lower.
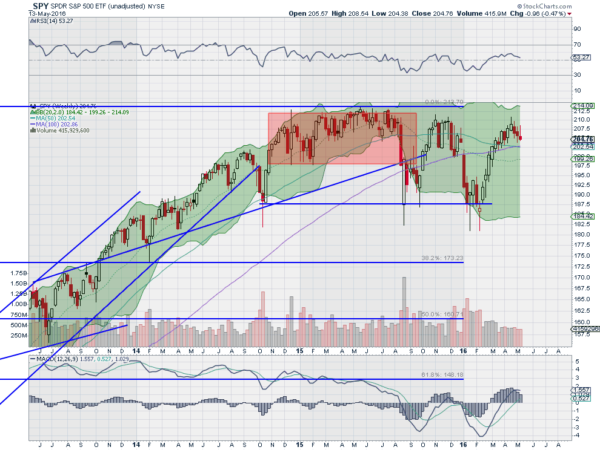
The Bollinger Bands are also opening to the downside. Things line up lower on this timeframe. On the weekly chart, the third red candle in a row looks like a bull flag. Only the RSI is below the bullish zone and the MACD is turning lower. There is support at 203.75 and 201.50 followed by 200 and 198.25. Resistance higher comes at 206 and 207.60 followed by 208.50 and 210.75.
There is consolidation with a downward bias.
SPY Weekly
Heading into May Options Expiration, the equity markets continue to look weak. Elsewhere look for gold to consolidate in its uptrend while crude oil continues higher. The US dollar index looks to continue the bounce in the downtrend while US Treasuries are biased higher. The Shanghai Composite and Emerging Markets look better to the downside.
Volatility looks to remain subdued, though keeping the bias higher for the equity index ETF’s SPY, IWM and QQQ, despite their moves lower. Their charts look better to the downside, with the IWM the worst, then the SPY and the QQQ with the best chance to consolidate and reverse. Use this information as you prepare for the coming week and trad’em well.
Disclaimer: The information in this blog post represents my own opinions and does not contain a recommendation for any particular security or investment. I or my affiliates may hold positions or other interests in securities mentioned in the blog, please see my Disclaimer page for my full disclaimer.
