Last week’s review of the macro market indicators saw that heading into the unofficial beginning of summer equities looked strong. Elsewhere looked for gold (GLD (NYSE:GLD)) to consolidate with a bias higher while Crude Oil (USO (NYSE:USO)) consolidated with a bias lower. The US dollar index (DXY) was in a downtrend while US Treasuries (TLT) consolidated with a bias higher.
The Shanghai Composite (ASHR) had stalled in the retrenchment and was consolidating while the Emerging Markets (EEM) continued to move higher. Volatility (VXX) looked to remain at abnormally low levels keeping the bias higher for the equity index ETF’s SPY, IWM and QQQ. The SPY (NYSE:SPY) and QQQ (NASDAQ:QQQ) were showing strength on both the daily and weekly timeframes while the small cap IWM was already running out of gas.
The week played out with gold continuing sideways before a move up to end the week while crude oil moved lower all week. The US dollar moved slightly lower while Treasuries moved up to test the April highs. The Shanghai Composite continued to hold steady in a tight range while Emerging Markets held at their recent highs. Volatility was muted and kept to a tight range near 10.
The Equity Index ETF’s started the week with small range moves and then pushed hard to the upside out of consolidation late in the week. The SPY ended with back to back all-time highs and the QQQ 3 new all-time highs out of the 4 days. Maybe more important was the strength in the IWM as it moved back to a few pennies from its all-time high. What does this mean for the coming week? Lets look at some charts.
SPY Daily, SPY

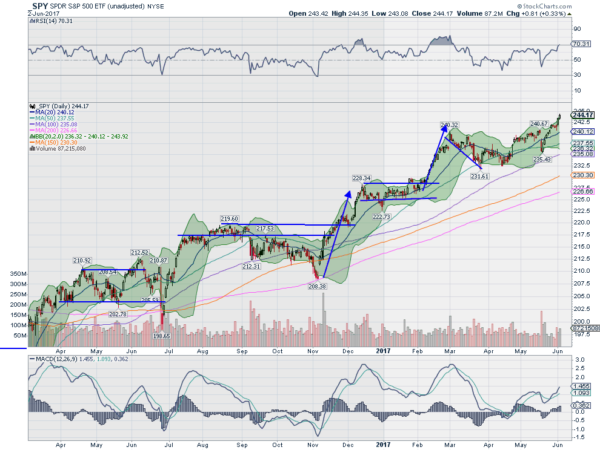
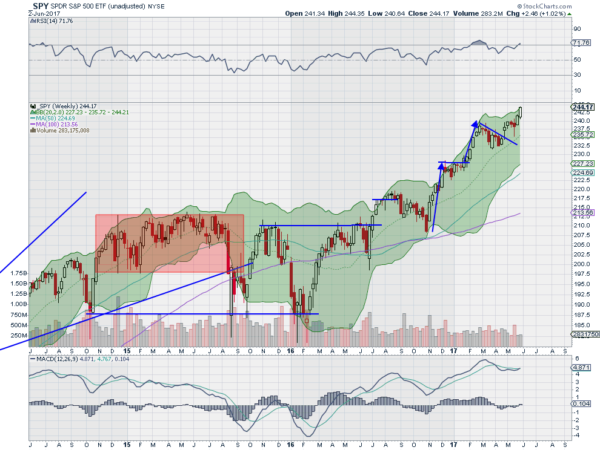
The SPY came into the holiday shortened week after a break out of a 3 month consolidation to a new all-time high. It spent Tuesday and Wednesday consolidating that move before a strong follow through to the upside Thursday and Friday. Two more all-time high closes to end the week in addition to a weekly all-time high close and a monthly all-time high close for May. This is a bullish story.
The daily chart shows the Bollinger Bands® opening as it moves higher. The RSI is bullish and rising, only just getting to the edge of technically overbought levels at 70. The last time it hit this level the RSI continued higher and price gained another 4% before stalling. The MACD is rising but nowhere near extreme levels.
The weekly chart shows continuation higher out of the short consolidation, and a Marubozu candle, finishing at the high. The RSI on this timeframe is just peeking into overbought territory, not a worry yet. The MACD is about to cross up, which would be a buy signal. There is no resistance above, but Measured Moves give targets next in the 247 to 248 range. Support lower comes at 243.25 and 242 followed by 240 and 238. Continued Uptrend.
SPY Weekly, SPY

Heading into the first full week of June equity markets look strong. Elsewhere look for gold to push higher in consolidation while Crude Oil moves lower in its consolidation. The US dollar index continues to look weak and moving lower while US Treasuries are biased higher. The Shanghai Composite remains in consolidation and Emerging Markets are biased to continue higher.
Volatility looks to remain at abnormally low levels keeping the bias higher for the equity index ETF’s SPY, IWM and QQQ. Their charts show strength in the SPY and QQQ on both timeframes, with the QQQ starting to get extended on a momentum basis. The IWM looks strong on the longer timeframe as is slowly rises, but at the top of resistance short term. Use this information as you prepare for the coming week and trad’em well.
The information in this blog post represents my own opinions and does not contain a recommendation for any particular security or investment. I or my affiliates may hold positions or other interests in securities mentioned in the Blog, please see my disclaimer page for my full disclaimer.
