Last week’s review of the macro market indicators saw equities mixed heading into the June Options Expiration Week, with the IWM and SPY (NYSE:SPY) looking strong but the QQQ weak as there was rotation out of the PowerShares QQQ and into Russell 2000 (NYSE:IWM). Elsewhere looked for GLD to continue lower while crude oil (United States Oil (NYSE:USO)) also looked better to the downside. The US Dollar Index continued to be biased lower while US Treasuries (NASDAQ:TLT) pulled back in the uptrend.
The Shanghai Composite was back to its upward drift and Emerging Markets (NYSE:EEM) were biased to continue higher. Volatility looked to remain at very low levels keeping the bias higher for the equity index ETF’s SPY, IWM and QQQ. Their charts showed strength in the IWM and consolidation in the SPY short term with the QQQ looking diseased. Longer term all trends remained higher with real strength returning to the IWM.
The week played out with gold pushing lower to its 200 day SMA while crude oil started with a bounce but sold off later in the week. The US dollar tightened its range finding some support while Treasuries ended their pull back and jumped to new 7 month highs. The Shanghai Composite pulled back in the uptrend while Emerging Markets continued to meet resistance and pulled back modestly.
Volatility continued to hold at unusually low levels, under the teens. The Equity Index ETF’s all started the week to the upside, but exhausted their move by Wednesday. They all moved lower after the FOMC announcement and continued to new lows Friday. The SPY ended down over half of a percent and the IWM and QQQ down over 1.5% on the week, but without a threat to the long term uptrends. What does this mean for the coming week? Lets look at some charts.
SPY Daily, SPY

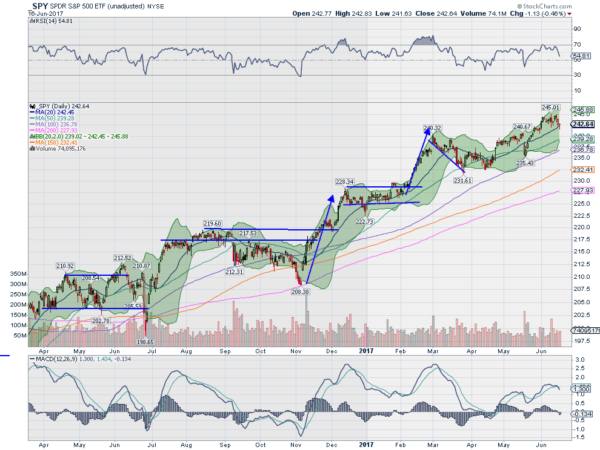
The SPY spent the week in a narrow range of only 3.25 points, despite an FOMC meeting, going ex-dividend and Quadruple Witching Friday. And people wonder why the Volatility Index is so low. A small move higher in that range gave a new all-time high close Tuesday ahead of that FOMC meeting and it opened higher Wednesday as well only to pullback after the statement and press conference where the FOMC raised rates as expected. It seemed back on the move higher Thursday but then dropped again Friday, only to recover and close at the 20 day SMA with a Hammer candle.
This could indicate a very short term reversal higher if confirmed with a higher close Monday. In a more moderate timeframe the SPY has really just moved sideways since making a new high to start June. The daily chart shows the RSI pulling back and making a 2 month low, but still firmly in the bullish zone. The MACD is crossed down as well, but remains positive at this point. Some negative divergences with momentum but still holding strong.
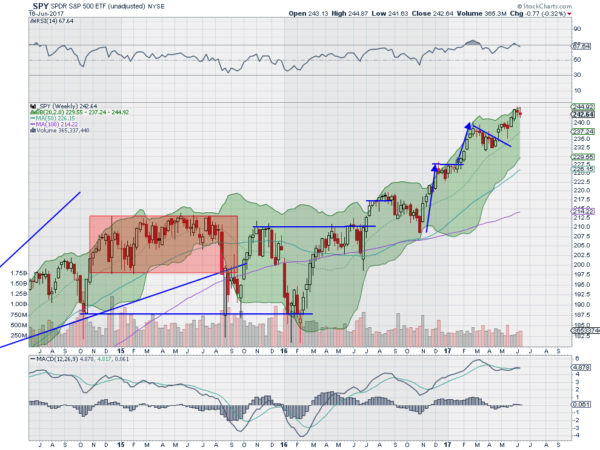
On the weekly chart a second small red candle after the move up suggests a digestive bull flag. The move comes off of the upper Bollinger Band® and remains inside the last up candle so far. The RSI is strong in the bullish zone, pulling back from an overbought condition, while the MACD is flat and positive. There is resistance at 245 and then free air above. Support lower comes at 242 and 240 followed by 238 and 237.10 then 236. Consolidation in the Uptrend.
SPY Weekly, SPY

With Options Expiration and the June FOMC meeting in the rear view mirror equities look to emerge on the other side mainly unscathed. There is consolidation in the SPY and IWM but perhaps more damage in the QQQ. Elsewhere look for Gold to continue to pullback while Crude Oil trends lower. The US Dollar Index has moved to consolidation in its pullback while US Treasuries are biased to continue higher.
The Shanghai Composite and Emerging Markets are biased to the upside with the Chinese market drifting up, while Emerging Markets consolidate in their longer trend up.
Volatility looks to remain at abnormally low levels keeping a breeze at the backs of equities. Their charts show continued strength in all 3 Index ETF’s on the longer timeframe but consolidation in the SPY and pullbacks in the IWM and QQQ on the shorter timeframe. Use this information as you prepare for the coming week and trad’em well.
The information in this blog post represents my own opinions and does not contain a recommendation for any particular security or investment. I or my affiliates may hold positions or other interests in securities mentioned in the Blog, please see my Disclaimer page for my full disclaimer.
