
Last week’s review of the macro market indicators noted after tying up the second quarter and heading into the Fourth of July Holiday Weekend, equities had held up well, but with a first crack in the armor for the QQQ. Elsewhere looked for gold (NYSE:GLD) to consolidate sideways while crude oil (NYSE:USO) continued higher short term. The US Dollar Index was weak and looked to continue lower while {{|US Treasuries}} were also biased lower after a reversal.
The Shanghai Composite and Emerging Markets (NYSE:EEM) were biased to the upside with risk that Emerging Markets continued to consolidate in the short run. Volatility looked to remain at very low levels keeping the bias higher for the equity index ETF's SPY, IWM and QQQ. Their charts were more mixed than they have been with the QQQ showing some signs of weakness on both timeframes while the SPY and IWM were still strong.
The week played out with gold dumping lower and pausing before a second wave down to end the week while crude oil found a top Wednesday and pulled back slightly. The US dollar found support and stayed there while Treasuries continued lower all week. The Shanghai Composite continued to slowly move up while Emerging Markets fell to test the bottom of the recent consolidation range.
Volatility crept slightly higher, but held short of the teens. The Equity Index ETF’s held in tight ranges for the Holiday shortened week with the SPY and IWM starting higher but giving back the gains later in the week. The QQQ was most stable, perhaps finding a bottom. All 3 then ended the week on a high note rising Friday. What does this mean for the coming week? Lets look at some charts.
SPY Daily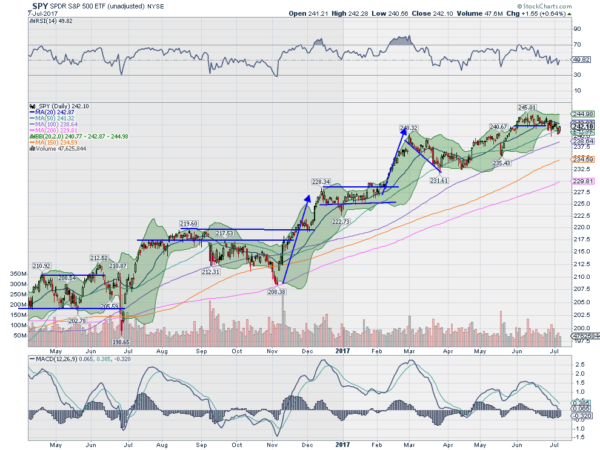
The SPY continued a drift lower in consolidation. Monday it bounced up to the 20 day SMA but could not get through. Wednesday, after the holiday, it tried again but printed a doji candlestick, signaling indecision. It fell lower Thursday, breaching its 50 day SMA for the first time since the May 18th low and then reversed back higher Friday. In all it traveled just over 3 points on the week, not too significant.
The daily chart shows the RSI holding around the mid line in the bullish zone but with the MACD continuing lower and nearing a move to negative. No damage on this timeframe, just a drawn out consolidation or bull flag. On the longer timeframe the picture looks very bright. The bull flag completed in its 6th week. The RSI is strong and bullish but has reset from overbought, while the MACD is basically moving sideways.
There is resistance at 245 above and then free and a Measured Move to 248 should it make a new high. Support lower sits at 242 and 240 followed by 238 and 237.10 before 236. Continued Consolidation in the Uptrend.
SPY Weekly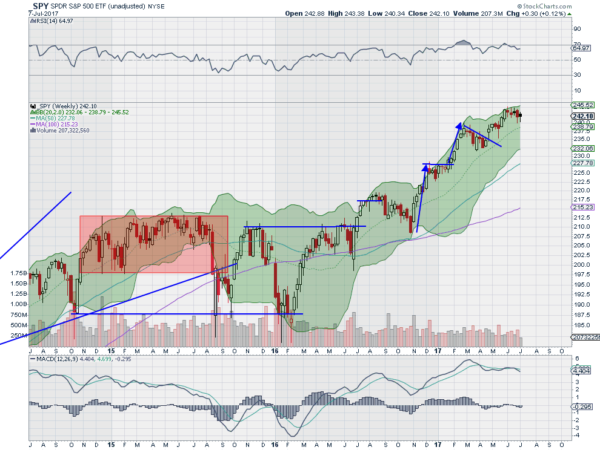
Heading into the last quiet week before earnings season the equity markets have weathered a short term drizzle (SPY and IWM) or mild rainstorm (QQQ) and look solid on the longer timeframe. Elsewhere look for Gold to move lower as it breaks support while Crude Oil also continues lower short term. The US Dollar Index continues to look weak and better to the downside while US Treasuries continue to move lower.
The Shanghai Composite looks to continue the trend higher as Emerging Markets mark time sideways in the uptrend. Volatility looks to remain at very low levels keeping the bias higher for the equity index ETF’s SPY, IWM and QQQ. Longer term their charts agree. Short term they are all consolidating and holding over support zones. Use this information as you prepare for the coming week and trad’em well.
The information in this blog post represents my own opinions and does not contain a recommendation for any particular security or investment. I or my affiliates may hold positions or other interests in securities mentioned in the Blog, please see my Disclaimer page for my full disclaimer.