Elsewhere looked for Gold (ARCA:GLD) to continue lower along with Crude Oil (NYSE:USO). The US Dollar Index (NYSE:UUP) was breaking out higher and US Treasuries (ARCA:TLT) might be ready to reverse higher as well. The Shanghai Composite (NYSE:ASHR) and Emerging Markets (ARCA:EEM) were both reversing higher and the week might determine if it is a Dead Cat Bounce or the real deal.
Volatility (ARCA:VXX) looked to remain subdued and with a bias lower building a tailwind behind the equity index ETF’s ARCA:SPY, ARCA:IWM and NASDAQ:QQQ. The QQQ looked very strong as it approached the all-time highs of 2000 while the SPY was also strong and on the edge of a break out. The IWM looked the weakest as it moved sideways in a new consolidation.
The week played out with gold continuing lower looking like a solid breakdown while Crude Oil trended lower all week as well. The US dollar moved slightly higher before retesting the breakout while Treasuries did reverse higher printing a higher high. The Shanghai Composite pushed higher, breaking above consolidation, the real deal, while Emerging Markets reversed lower, the Dead Cat Bounce.
Volatility made a new low for the year before rebounding slightly into the teens. The Equity Index ETF’s started the week mixed but ended worse, with the SPY and QQQ making new higher highs and the QQQ a new 15 year high, before pulling the rest of the week. The IWM was similar but without the Monday good news. What does this mean for the coming week? Lets look at some charts.
SPY Daily
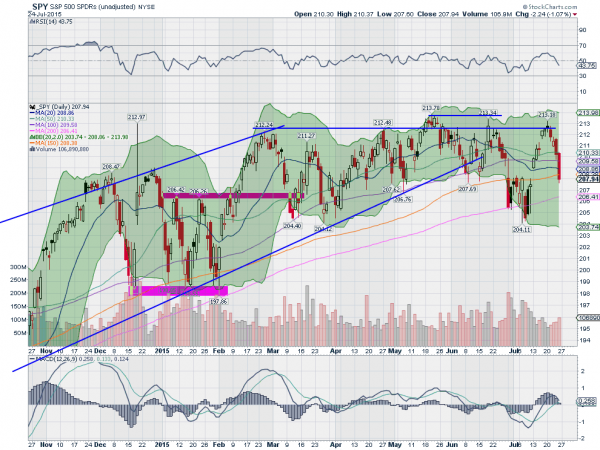
The SPY started the week on a positive note, pushing up through the resistance zone at 212.50 and near the all-time highs. But that did not even last a day. The end result of Monday was a Solid Black Spinning Top candle. The solid black showing the downward intraday bias despite an up day, and the spinning top the indecision. This resolved Tuesday to the downside and then continued the rest of the week, with longer accelerating candlestick.
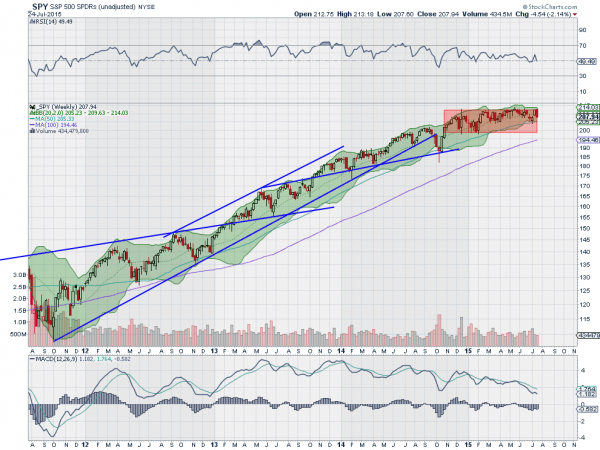
Both of the gaps from the recent upward move were closed along the way. Also note that the price action ended up making a lower high to go with the lower low to start July. The RSI on the daily chart turned back as it touched the edge of the bullish zone while the MACD is curling down looking for a cross down. A bit bearish on this timeframe. The weekly chart shows a bearish engulfing candle, but still in the top of the long consolidation zone since October.
The RSI continues to hold in the bullish zone over the mid line while the MACD retraces lower. The Bollinger Bands® are getting tighter too. There is support lower at 206.40 and 205.25 before 204.40 and 203. Resistance above now stands short term at 209 and 210.25 followed by 211 and longer term at 212.50 and 213.40. Pullback in the Intermediate Consolidation in the Long Term Uptrend.
SPY Weekly
Heading into the last week of July the equity markets are a bit weaker but mixed with the tech names the strongest. Elsewhere look for Gold to continue lower along with Crude Oil. The US Dollar Index may move sideways or continue higher while US Treasuries are biased to the upside. The Shanghai Composite is looking stronger and has almost dispelled all possibility of a Dead Cat Bounce while and Emerging Markets are confirming the resumption of the move lower.
Volatility looks to remain subdued keeping the bias higher for the equity index ETF’s SPY, IWM and QQQ. Their charts are a bit mixed, with all better on the longer timeframe. The QQQ is the leader on the weekly timeframe with the IWM next and then the SPY. On the shorter timeframe the QQQ’s are also looking the strongest with the SPY and IWM worse, but all biased lower short term. Use this information as you prepare for the coming week and trad’em well.
DISCLAIMER: The information in this blog post represents my own opinions and does not contain a recommendation for any particular security or investment. I or my affiliates may hold positions or other interests in securities mentioned in the Blog, please see my Disclaimer page for my full disclaimer.
