Last week’s review of the macro market indicators suggested, heading into July Options Expiration week that the equity markets still looked vulnerable short term in their longer term uptrends.
Elsewhere looked for gold (ARCA:GLD) continue to test the downside while crude oil (NYSE:USO) also turned lower. The US Dollar Index (NYSE:UUP) seemed ready to move higher in its consolidation while US Treasuries (ARCA:TLT) were biased lower in their consolidation. The Shanghai Composite (NYSE:ASHR) and Emerging Markets (ARCA:EEM) were both bouncing and need to be watched carefully to see if the moves were real.
Volatility (ARCA:VXX) looked to remain in the elevated range of this low level, continuing to lessen the tail wind for the equity index ETF’s ARCA:SPY, ARCA:IWM and NASDAQ:QQQ. Their charts showed the IWM looking the best short term as they all tried to hold and reverse higher, while the QQQ and IWM looked good longer term as the SPY was weakest.
The week played out with gold continuing lower while crude oil started flat but then leaked lower late in the week. The US dollar found support and broke out of the range higher while Treasuries also found support and bounced, but remained in the consolidation range. The Shanghai Composite absorbed the bounce on a small pullback and then moved higher while Emerging Markets held in a tight range.
Volatility moved sharply lower, touching a new 7 month low giving a strong tailwind to Equities. The Equity Index ETF’s all jumped on the week, with the SPY stalling at the prior high area in the mid 212’s, the IWM at the late June support before the move lower and the QQQ taking charge, running to new 15 year highs. What does this mean for the coming week? Lets look at some charts.
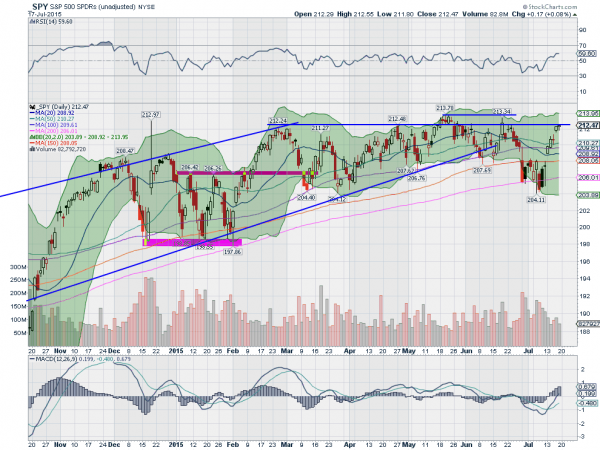
SPY Daily
The SPY started the week gapping back over the 150 day SMA Monday. It continued higher all week with a brief teasing pause Wednesday. The price closed the week Friday at resistance of the past 4 months in a strong week. The daily chart shows the RSI is rising, making a higher high and about to move into the bullish zone. The MACD is rising as well. Quite bullish on the short timeframe.
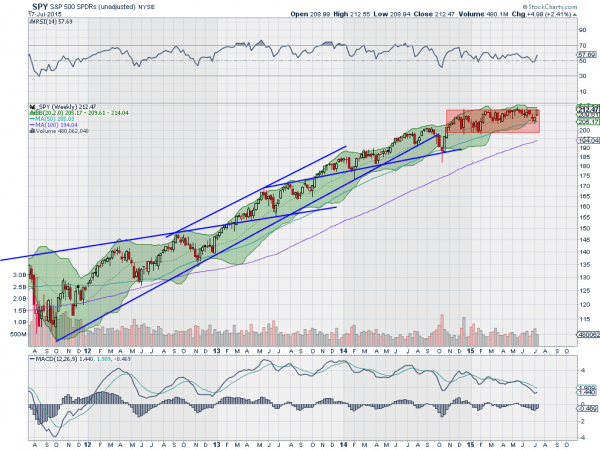
On the weekly chart the price printed a bullish Marubozu candle that took it to the top of the 9 month consolidation box. The RSI has turned back higher, remaining bullish with the MACD stopping its fall and turning up. It still has some work to do before a bullish cross though. There is resistance here at 212.50 and 213.35 above then you could draw a Measured Move to 218. Support lower comes at 211 and 210.25 followed by 209 and 208 before 206.40 and 204.40. Upward Bias in the Consolidation in Long Term Uptrend.
SPY Weekly
Heading into next week the thermometer is getting hotter and the so are the equity markets with the QQQ leading the charge. Elsewhere look for gold to continue lower along with crude oil next week. The US Dollar Index is breaking out higher and US Treasuries may be ready to reverse higher as well. The Shanghai Composite and Emerging Markets are both reversing higher and the coming week could determine if it is Dead Cat Bounces or the real deal.
Volatility looks to remain subdued and with a bias lower build a tailwind behind the equity index ETF’s SPY, IWM and QQQ. The QQQ looks very strong as it approaches the all-time highs of 2000 while the SPY is also strong and on the edge of a break out. The IWM looks the weakest as it moves sideways in a new consolidation. Use this information as you prepare for the coming week and trad’em well.
DISCLAIMER: The information in this blog post represents my own opinions and does not contain a recommendation for any particular security or investment. I or my affiliates may hold positions or other interests in securities mentioned in the Blog, please see my Disclaimer page for my full disclaimer.
