Last week’s review of the macro market indicators suggested, heading into the heat of summer, the Equity markets looked vulnerable on the short time frame and just sideways on the longer time frame.
Elsewhere looked for gold (ARCA:GLD) to continue the broad consolidation with a downward bias, while crude oil (NYSE:USO) looked to move lower. The US dollar index (NYSE:UUP) looked to continue to consolidate in a tightening range sideways, while US Treasuries (ARCA:TLT) were consolidating but biased lower. The Shanghai Composite (NYSE:ASHR) was crashing and showing no sign of letting up yet, while Emerging Markets (ARCA:EEM) might bounce in their downtrend.
Volatility (ARCA:VXX) looked to remain low, but above recent levels and with a risk of more upside, easing the tailwind it has given the equity indexes. The ETF’s ARCA:SPY, ARCA:IWM and NASDAQ:QQQ, themselves all appeared vulnerable on the daily timeframe, with the QQQ, the strongest, looking flat. On the longer timeframe, the QQQ was also looking the strongest, but had pulled back to trend support, with the IWM looking weaker. Perhaps some rotation out of small caps and into technology and larger caps was to come.
The week played out with gold drifting lower, while crude oil took a dive lower and then consolidated. The US dollar moved slightly higher to resistance before a small pullback, while Treasuries broke overhead resistance but then pulled back. The Shanghai Composite continued lower, finding its 200 day SMA and then bounced, while Emerging Markets finally found a bottom and bounced slightly.
Volatility remained low, but in the recent higher area over the SMA’s. The Equity Index ETF’s pushed to lower lows, before recovering to finish the week mostly unchanged to slightly higher. What does this mean for the coming week? Let's look at some charts.
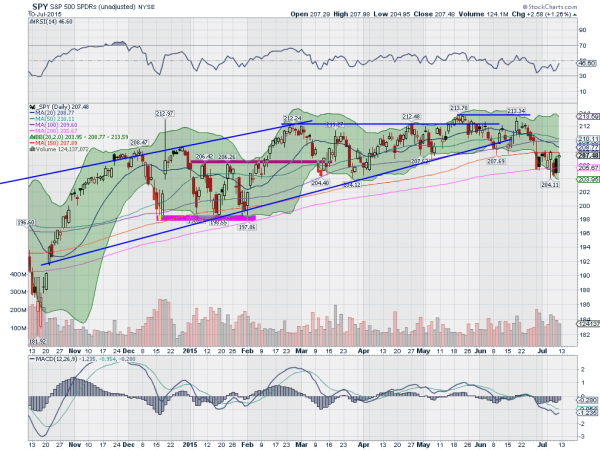
SPY Daily
The SPY started the week in the lower tight range it spent the holiday shortened week in. Tuesday pushed lower but recovered in a bullish engulfing candle, but it was not confirmed Wednesday. In fact, the next three days remained inside the range of Tuesday. The failed attempt to move higher Thursday had many thinking a new leg lower was in the offing, until Friday had a strong move back higher. Lots of action all around the 200 day SMA to end the week flat.
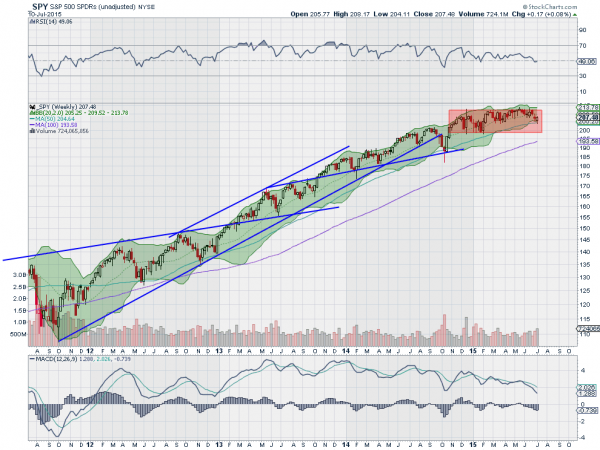
The daily chart shows the RSI remaining in the bearish zone, but pushing higher towards the mid line, while the MACD is trying to kink back up after its fall. You would have to have a short term bearish bias or at least be protecting. On the weekly chart, the price remains within the long consolidation zone that began in October. A touch at the lower Bollinger Band® seems to have halted the fall for now. The RSI on this timeframe is holding at the mid line, while the MACD continues lower. Not as bad on this timeframe.
There is support lower at 206.40 and 204.40, followed by 203 and 202, before the round number at 200 and then 198.40. Resistance higher stands at 208 and 209, followed by 210.25 and 211, before 212.50 and 213.40. Short Term Consolidation with a Downward Bias as It Consolidates Long Term in the Uptrend.
SPY Weekly
Heading into July Options Expiration week, the equity markets still look vulnerable short term in their longer term uptrends. Elsewhere, look for gold continue to test the downside, while Crude Oil also turns lower. The US dollar index seems ready to move higher in its consolidation, while US Treasuries are biased lower in their consolidation. The Shanghai Composite and Emerging Markets are both bouncing, and need to be watched carefully to see if the moves are real.
Volatility looks to remain in the elevated range of this low level, continuing to lessen the tail wind for the equity index ETF’s SPY, IWM and QQQ. Their charts show the IWM looking the best short term, as they all try to hold and reverse higher, while the QQ and IWM look good longer term, as the SPY is weakest. Use this information as you prepare for the coming week and trad’em well.
