Last week’s review of the macro market indicators found, heading into the last week of January, equity markets seemed to have found some footing but still had to prove themselves. Elsewhere looked for gold (N:GLD) to move higher in its downtrend while crude oil (N:USO) bounced and showed us if it wanted a reversal.
The US Dollar Index (N:UUP) was on the edge of a break out higher while US Treasuries (N:TLT) were biased lower short term in the move higher. The Shanghai Composite (N:ASHR) was consolidating in the downtrend while Emerging Markets (N:EEM) paused in their move lower. Volatility (N:VXX) looked to remain elevated but drifting lower keeping the bias lower for the equity index ETFs N:SPY, N:IWM and O:QQQ, but loosening the vice grip. The ETFs themselves all looked to continue the bounce in their downtrends with some work left to show that the worst was over.
The week played out with gold pushing higher over 1100 while crude oil started lower but rebounded to end the week higher. The US dollar ran lower all week before a rebound Friday while Treasuries consolidated all week until squeezing higher Friday. The Shanghai Composite broke its consolidation to the downside while Emerging Markets started to inch higher.
Volatility continued to drift lower, but with a wild range day mid week. The Equity Index ETFs started the week generally moving sideways but all finished strong Friday, with the SPY making a short term high, and the QQQ and the IWM back at short term resistance. What does this mean for the coming week? Lets look at some charts.
SPY Daily

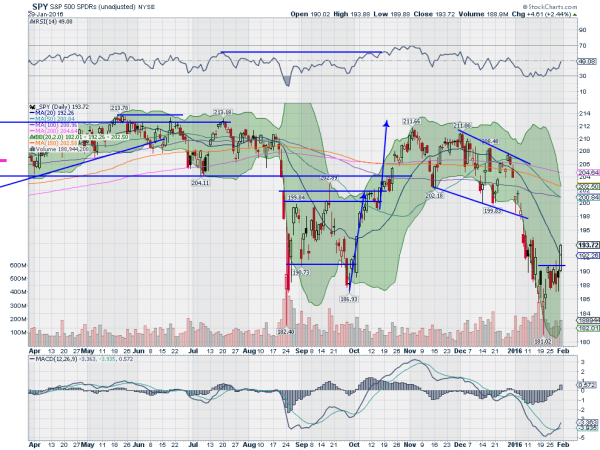
The SPY spent the bulk of the week churning under resistance before exploding to the upside on Friday. There is nothing notable in the price action the front part of the week but a positive divergence was extended in the momentum indicators. The RSI on the daily chart pushed higher, finally breaking the support zone, now resistance, from mid December and ran to the mid line. The MACD crossed up as it rose. These both support more upside.
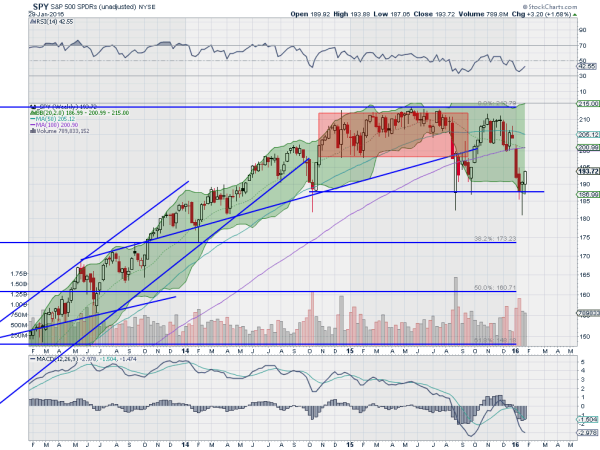
The candle Friday finished just off of the high level, a near Marubozu, and over the 20 day SMA for the first time since December 31st. On the weekly chart the strong move Friday translated into a bullish candle confirming the Hammer from last week as a reversal higher. The RSI on this timeframe is also moving up although the MACD continues lower. There is resistance above at 194.80 and 196 followed by 198.50 and 200. Over 196 will attract some money into the market. Support lower comes at 191.50 and 189.50 followed by 188 and 187. Short Term Reversal Higher.
SPY Weekly

After completing a horrible January at least it ended on a good note in the equity markets. On to February and look for gold to continue higher in the short run while crude oil maintains a short run bias higher in the downtrend. The US Dollar Index continues to look ready to explode higher while US Treasuries may be ready to consolidate in the uptrend. The Shanghai Composite still looks like it is headed lower while Emerging Markets are biased to the upside in their downtrend.
Volatility is drifting lower towards normal levels relieving some of the pressure on the equity index ETFs SPY, IWM and QQQ. Their charts all had great moves higher Friday and look to continue in the short term, while the weekly charts showed strong signals of reversals higher. The QQQ is the only short term chart that did not break resistance. Use this information as you prepare for the coming week and trad’em well.
Disclaimer: The information in this blog post represents my own opinions and does not contain a recommendation for any particular security or investment. I or my affiliates may hold positions or other interests in securities mentioned in the Blog. Please see my Disclaimer page for my full disclaimer.
