Last week’s review of the macro market indicators noted with January Options Expiration behind, the Equity markets looked extremely strong and perhaps overheated. Elsewhere looked for Gold (GLD (NYSE:GLD)) to pause in its uptrend while Crude Oil (USO (NYSE:USO)) slowed as it hit resistance as well. The US Dollar Index looked destined to move lower while US Treasuries (TLT) were biased lower in consolidation. The Shanghai Composite (ASHR) and Emerging Markets (EEM) were poised to continue to new multi-year highs.
Volatility ($VXX) looked to remain at very low levels keeping the bias higher for the equity index ETF’s $SPY, $IWM and $QQQ. They were lining up on both the shorter and longer timeframe with the SPY (NYSE:SPY) overheated and at extreme momentum levels, the QQQ also overbought but not quite extreme, while the IWM was just getting going. This could easily lead to rotation into the IWM from the other Indexes.
The week played out with Gold starting the week to the upside but then finding resistance and stalling while Crude Oil made a second move to the upside. The US Dollar continued lower to 2 year lows while Treasuries bounced around in consolidation at a lower range. The Shanghai Composite continued to move up to multi-year highs while Emerging Markets also moved up and are now close to all-time highs.
Volatility held in a tight band near 11, keeping the bias higher for equities. The Equity Index ETF’s all started the week moving higher, with the SPY, IWM and QQQ all printing new all-time highs. But mid-week the SPY and QQQ consolidated that move while the IWM pulled back slightly first before consolidating. What does this mean for the coming week? Lets look at some charts.
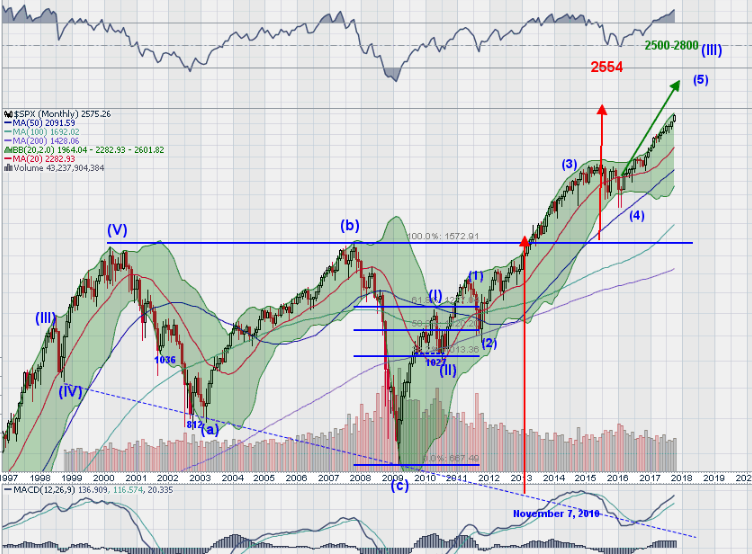
The SPY entered the week at an all-time high and a bit overheated. But that did not stop it from continuing higher and printing new all-time high closes 4 out of 5 days during the week, including the Friday close. The move added another 2.20% for the week and made for the 14th record close this year.
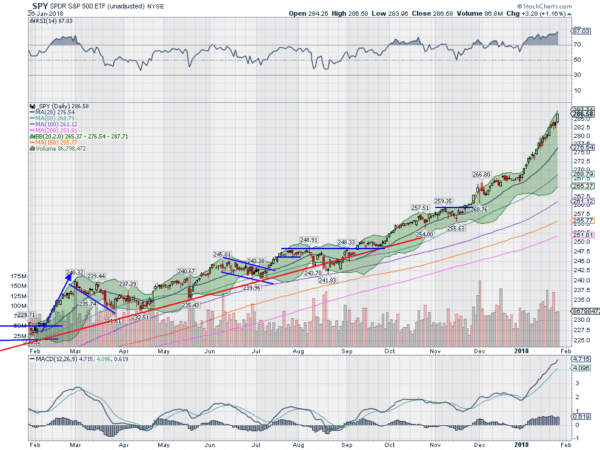
The daily chart shows the RSI strong and deep into overbought territory. The MACD is also rising and getting to lofty levels. The Bollinger Bands® however are continuing to open to the upside and allow for further movement. The price is getting a bit extended from the 20 day SMA, but all of the SMA’s are rising in parallel.
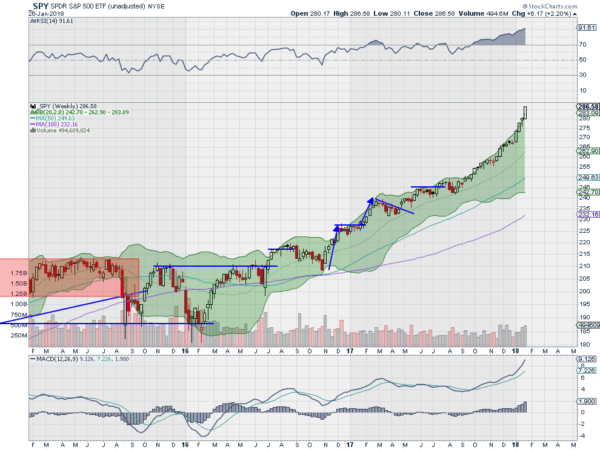
On the weekly chart it was another strong week following the hanging man last week. This makes for 4 weeks in a row to the upside out of consolidation. The RSI on this timeframe is getting extreme at over 91. The MACD is rising and getting to rarely seen levels as well. There is no resistance higher and the Marubozu candle bodes for more upside. There is support below at 282 and 280 followed by 278 and 275. It may pullback sometime soon but…. Continued Uptrend.
Heading into the last days of January equity markets continue to drive higher and are running hot. Elsewhere begins look for Gold to continue in its uptrend while Crude Oil drives higher as well. The US Dollar Index continues to look weak and better to the downside while US Treasuries are biased lower in consolidation. The Shanghai Composite and Emerging Markets are poised to continue to make new highs.
Volatility looks to remain low keeping the bias higher for the equity index ETF’s SPY, IWM and QQQ. Their charts continue to show the SPY the most overheated with the QQQ only moderately so, and the IWM ready to take the reigns and lead the markets. Use this information as you prepare for the coming week and trad’em well.
The information in this blog post represents my own opinions and does not contain a recommendation for any particular security or investment. I or my affiliates may hold positions or other interests in securities mentioned in the Blog, please see my Disclaimer page for my full disclaimer.


