Last week’s review of the macro market indicators found, after completing a horrible January at least it ended on a good note in the equity markets. On to February and look for for gold (N:GLD) to continue higher in the short run while crude oil(N:USO) maintains a short run bias higher in the downtrend. The US dollar index (N:UUP) continues to look ready to explode higher while US Treasuries (N:TLT) may be ready to consolidate in the uptrend. The Shanghai Composite (N:ASHR) still looks like it is headed lower while Emerging Markets (N:EEM) are biased to the upside in their downtrend.
Volatility (N:VXX) is drifting lower towards normal levels relieving some of the pressure on the equity index ETFs N:SPY, N:IWM and O:QQQ. Their charts all had great moves higher Friday and look to continue in the short term, while the weekly charts showed strong signals of reversals higher. The QQQ is the only short term chart that did not break resistance. Use this information as you prepare for the coming week and trad’em well.
The week played out with gold driving higher while crude oil pushed lower before a small bounce. The US dollar broke short term consolidation to the downside while Treasuries moved up to 10 month highs. The Shanghai Composite seems to have found some short term support while Emerging Markets remained muddled in a tight range just above the lows.
Volatility made a ticked higher but not to the excited levels of early January. The Equity Index ETFs moved generally sideways for the week ending at the lower end of their recent ranges, with the exception of the QQQ which took a header as it dumped Friday. What does this mean for the coming week? Lets look at some charts.
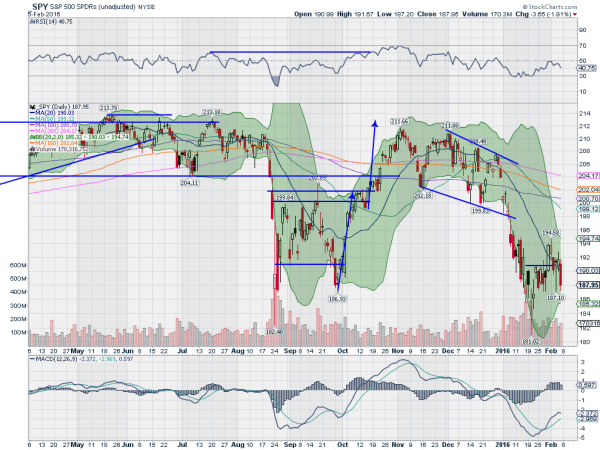
SPY Daily

The SPY started the week re-enforcing the move over the 20 day SMA, but had given back that ground by Tuesday. Wednesday printed a long tailed Doji, technically signaling indecision, but for many a reversal signal, and it was confirmed higher Thursday, only to fall back Friday and end the week with another touch near 187.10.
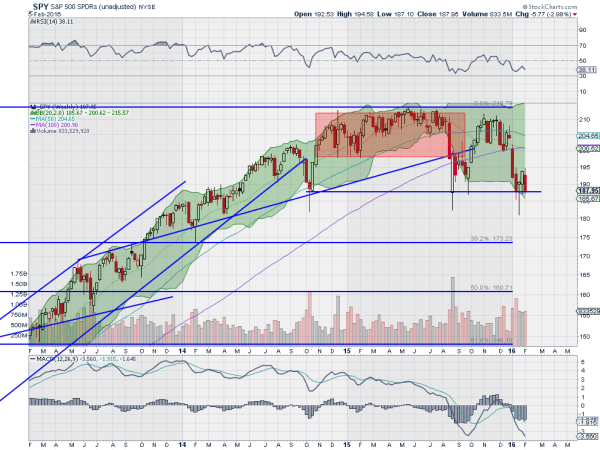
The daily chart shows the Bollinger Bands® squeezing in, often a precursor to a move. The RSI is pulling back from the mid line, remaining bearish, while the MACD is stalling in its rise. Short term looks weak. On the weekly chart the move lower comes back to support, wiping out the promising reversal last week showed. The RSI on this timeframe continues lower in the bearish zone with the MACD falling and now at the August low.
There is support right here at 188 and 187 followed by 184.60 and 181.35. Resistance higher comes at 189.50 and 191.50 followed by 194.50 and 196. Consolidation in the Short Term Downtrend.
SPY Weekly
The groundhog did not see his shadow and so an early spring is in store, but it does not seem like winter is over for equity markets. Heading into the second week of February equity markets are weak and looking to get worse. Elsewhere look for gold to continue in its uptrend while crude oil consolidates broadly in the downtrend. The US dollar index looks better to the downside in consolidation in the short run while US Treasuries are continue higher.
The Shanghai Composite and Emerging Markets look to continue their consolidation in their downtrends net week. Volatility looks to remain elevated keeping the bias lower for the equity index ETFs SPY, IWM and QQQ. The indexes themselves all look weak and ready for more downside with the strongest, the SPY, trying to consolidate in its downtrend. Use this information as you prepare for the coming week and trad’em well.
Disclaimer: The information in this blog post represents my own opinions and does not contain a recommendation for any particular security or investment. I or my affiliates may hold positions or other interests in securities mentioned in the Blog. Please see my Disclaimer page for my full disclaimer.
