A weekly excerpt from the Macro Review analysis sent to subscribers on 10 markets and two timeframes.
Last week’s review of the macro market indicators saw heading into February that Equity markets continued to look strong, especially on the intermediate charts. Elsewhere looked for gold (NYSE:GLD) to continue lower while crude oil (NYSE:USO) churned over support. The US dollar Index continued lower but may be bottoming while US Treasuries (NASDAQ:TLT) were biased lower. The Shanghai Composite was resuming its drift higher, but was closed until Friday while Emerging Markets (NYSE:EEM) worked higher.
Volatility (NYSE:VXX) looked to remain at abnormally low levels keeping the bias higher for the equity index ETF’s SPY (NYSE:SPY), IWM (NYSE:IWM) and QQQ (NASDAQ:QQQ). Their charts showed real strength continuing in the intermediate term. Shorter term the QQQ had been the leader but was getting a bit overheated, while the SPY and IWM might be ready to start higher out of consolidation.
The week played out with gold quickly finding a bottom and reversing higher while crude oil traded in a tight range. The US dollar failed in an attempt higher at the start of the week and drifted down while Treasuries marked time, moving sideways. The Shanghai Composite took a step lower Friday when it opened while Emerging Markets continued higher.
Volatility moved up off the extreme low but did not even become a teenager before falling back. The Equity Index ETF’s started the week to the downside, but all recovered by the end of the week, with the SPY and the QQQ ending at highs and the IWM within 1% of its high. What does this mean for the coming week? Lets look at some charts.
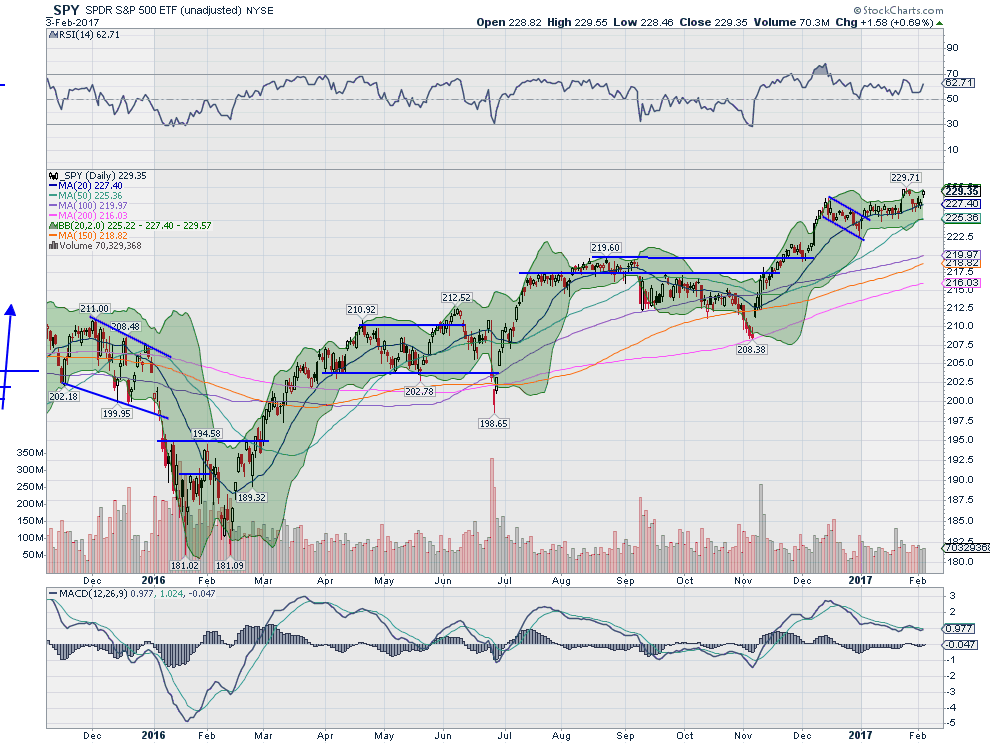
SPY Daily
The SPY fell to start the week, leaving a 3 day island top. It found support at the 20 day SMA and then hovered there through Thursday. Friday it jumped back higher again to that island and leaving another island below. The whole week saw small body candles and the price action stayed within just over a 3 point range, and ending within a fraction of the all-time high.
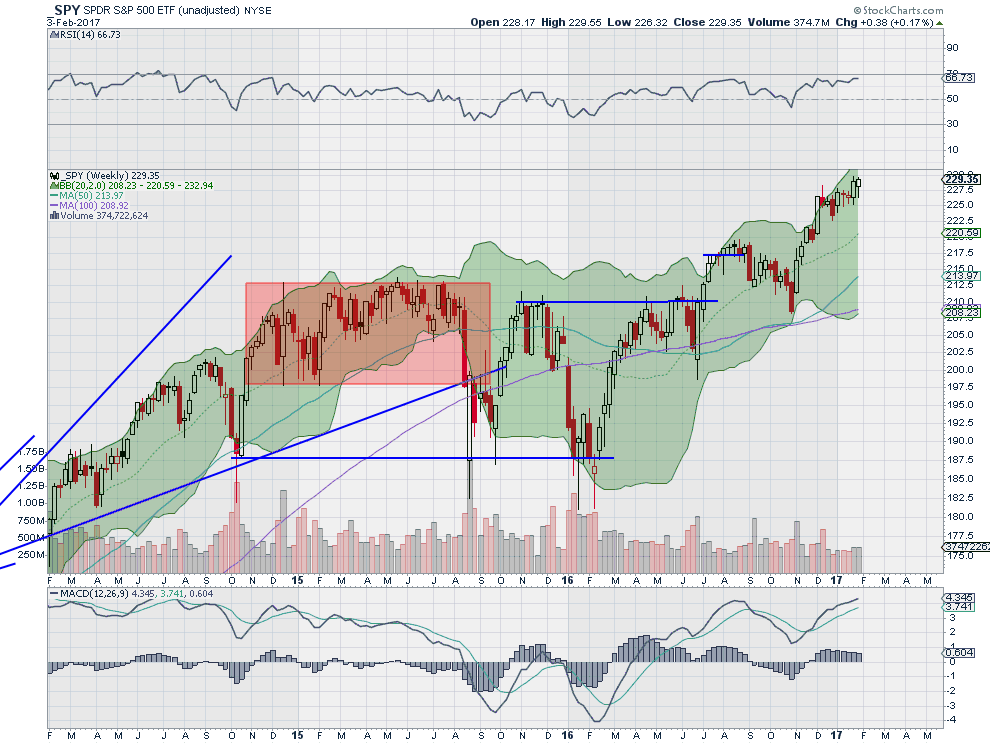
The daily chart shows the RSI rising in the bullish zone, while the MACD marks time, moving sideways. The Bollinger Bands® have started to open higher, a good sign for bulls. On the weekly chart, the SPY printed an inside week, but a second all-time weekly closing high in a row, with a drift out of consolidation higher. The RSI on this timeframe is bullish and strong with the MACD rising and bullish as well.
There is support lower at 228.25 and 226.50 followed by 225 and 224 then 221.75 and 220. Resistance above sits at 229.60. Above that there are Measured Moves to 230.70 and 234. Continued Uptrend.
SPY Weekly
With the first FOMC meeting of the year and the employment report behind, the Equity markets had a strong week and look primed for the next leg higher. Elsewhere look for gold to continue in its short term uptrend while crude oil churns with more sideways price action. The US dollar Index looks to continue to the downside, although it is at a good support area should it want to reverse, while US Treasuries are biased lower.
The Shanghai Composite looks to continue to drift around resistance but higher and Emerging Markets look to continue their recent strength. Volatility looks to remain at exceptionally low levels keeping the bias higher for the equity index ETF’s SPY, IWM and QQQ. Their charts all look strong on the weekly timeframe and are at the edge of breaking out of ranges on the daily timeframe. Use this information as you prepare for the coming week and trad’em well.
The information in this blog post represents my own opinions and does not contain a recommendation for any particular security or investment. I or my affiliates may hold positions or other interests in securities mentioned in the Blog, please see my Disclaimer page for my full disclaimer.
