Elsewhere looked for gold (ARCA:GLD) to consolidate or continue lower, while crude oil (NYSE:USO) moved to the downside. The US dollar index (NYSE:UUP) looked to move sideways with an upward bias, while US Treasuries (ARCA:TLT) were biased to continue higher. The Shanghai Composite (NYSE:ASHR) and Emerging Markets (ARCA:EEM) both were biased to the downside, but trying to consolidate.
Volatility (ARCA:VXX) looked to remain subdued, keeping the bias higher for the equity index ETFs ARCA:SPY, ARCA:IWM and NASDAQ:QQQ. Their charts suggested that there was potential for some weakness in the current move short term though. On the longer timeframe, the QQQ looked strong and perhaps ready for new all time highs, while the SPY was in consolidation and the IWM was in a retrenching consolidation.
The week played out with gold holding in a tight range, while crude oil took a turn lower. The US dollar inched higher, while Treasuries vacillated but ended to the upside. The Shanghai Composite moved sideways in a tight range, while Emerging Markets inched lower.
Volatility started lower and made a new 52 week low before rebounding slightly. The Equity Index ETFs started the week in a tight range, but by Wednesday, all had started lower and continued through Friday. What does this mean for the coming week? Lets look at some charts.
SPY Daily
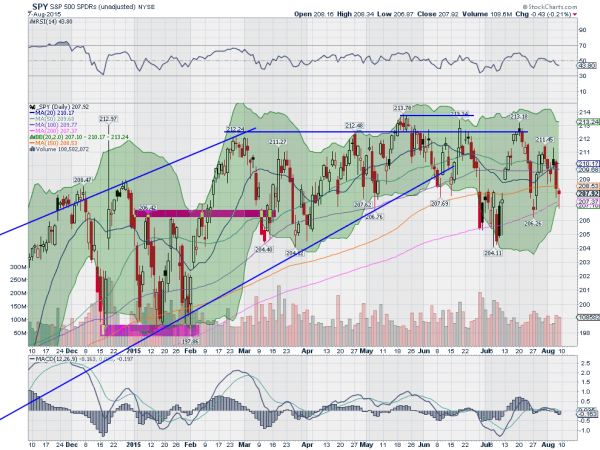
The SPY started the week pulling back to the confluence of the 20, 50 and 100 day SMA’s, with a long lower shadow. It continued lower Tuesday, but with a Harami (inside day) that brought out the possibility of a reversal back higher. It did move higher Wednesday, but gave back most of the gain printing a Solid Black candle, showing intraday weakness. This was confirmed lower Thursday with a strong down day.
The week ended with a push lower to the 200 day SMA and lower Bollinger Band®, before a bounce leading to a Hammer candle, a sign of a possible reversal. The daily chart shows the RSI remains in the bullish zone, but is falling again as it vacillates around the mid line. The MACD is falling and crossed down though. Both bullish and bearish signals on this timeframe.
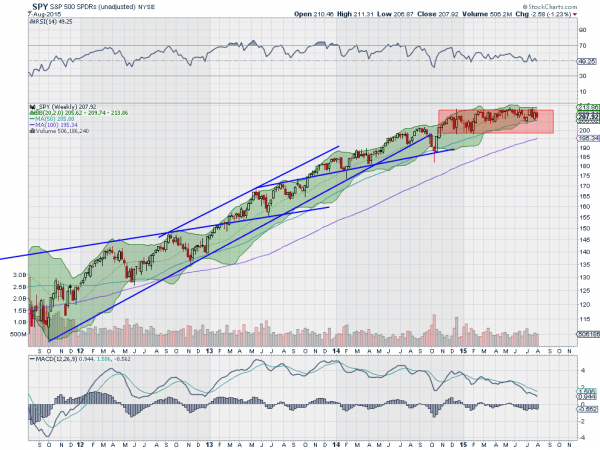
On the weekly chart, the price action continues to move in the upper half of a tight range that has held it since October. The 50 week SMA has been acting as support for the last 5 weeks as the Bollinger Bands tighten on the longer timeframe. The RSI on this timeframe is holding over the mid line in the bullish zone, with the MACD falling as the sole diverging indicator. There is resistance higher at 208 and 209, followed by 210.25 and 211 before 212.50 and 213.40. Support lower may come at 206.40 and 204.40, followed by 202 and 200. Continued Sideways Consolidation.
SPY Weekly
Heading into next week, the news and earnings dry up and Equities could use some quiet time to steady. Elsewhere, look for a possible bounce out of gold in its downtrend, while crude oil continues lower. The US dollar index looks to continue to consolidate with an upward bias, while US Treasuries continue higher. The Shanghai Composite remains in broad consolidation in the pullback, while Emerging Markets look like they may break a 4 year range to the downside.
Volatility looks to remain subdued, keeping the bias higher for the equity index ETFs SPY, IWM and QQQ, despite the moves lower. Their charts show further short term weakness possible, but the Hammer candles could confirm a short term bottom. On the longer timeframe, the IWM remains weakest with the SPY consolidating and the QQQ looking strong. Use this information as you prepare for the coming week and trad’em well.
Disclaimer: The information in this blog post represents my own opinions and does not contain a recommendation for any particular security or investment. I or my affiliates may hold positions or other interests in securities mentioned in the Blog. Please see my Disclaimer page for my full disclaimer.
