A weekly excerpt from the Macro Review analysis sent to subscribers on 10 markets and two timeframes.

Last week’s review of the macro market indicators noted that heading into August the Equity markets still looked strong but the smaller cap and technology laden indexes stronger than the large caps. Elsewhere looked for gold to continue its uptrend while Crude Oil continued lower. The US Dollar Index looked better to the downside short term while US Treasuries ($TLT) were biased higher.
The Shanghai Composite looked like it will continue to drift lower while iShares MSCI Emerging Markets (NYSE:EEM) moved higher. iPath S&P 500 VIX Short-Term Futures Exp 30 Jan 2019 (NYSE:VXX) looked to remain at abnormally low levels keeping the bias higher for the equity index ETF’s SPDR S&P 500 (NYSE:SPY), iShares Russell 2000 (NYSE:IWM) and PowerShares QQQ Trust Series 1 (NASDAQ:QQQ). Their charts showed real strength in the QQQ with the IWM ready to join it moving higher, while the SPY (NYSE:SPY) takes a pause.
The week played out with Gold probing lower before dropping hard after the employment report to end the week down while Crude Oil started lower but rebounded late in the week. The US Dollar moved slightly higher after a lower start while Treasuries pulled back slightly and consolidated. The Shanghai Composite found support and reversed higher while Emerging Markets drifted higher. Volatility made a new 1 year low to end the week at an extremely low level.
The Equity Index ETF’s started the week higher but then quickly reversed lower. A second reversal Wednesday had them racing higher, adding speed after the employment report Friday morning. This left the SPY with a new all-time high, the QQQ pennies away from an all-time high close and the IWM at a 52 week high but still about 5% below the all-time high. What does this mean for the coming week? Lets look at some charts.
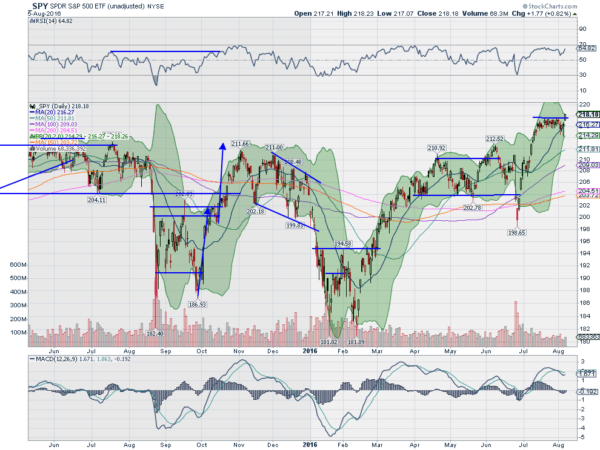
SPY Daily
The SPY spent almost a month consolidating the move higher off of the Brexit pullback. That is eons for short term traders but pretty short compared to the broad 18 month consolidation, with a couple of quick pullback, on a longer scale. The week started at that resistance top and fell back. A quick touch at the rising 20 day SMA and it gapped higher Friday, to new all-time highs. The candle Friday was nearly a Marubozu as well, supporting more upside. There is now an additional target on a Measured Move to 224.30. The daily chart shows the RSI turning back higher in the bullish zone, while the MACD is about to cross up. These support more upside.
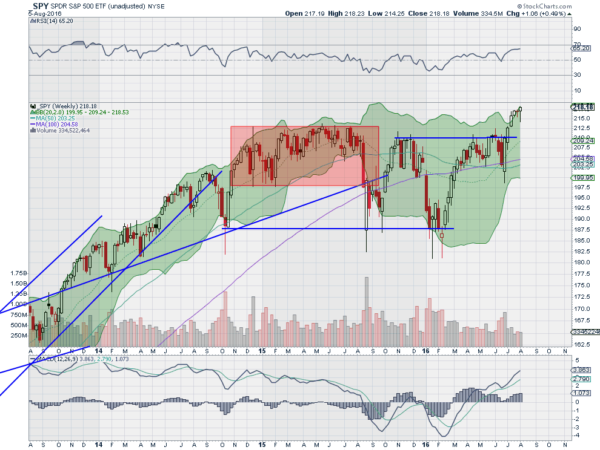
The weekly chart shows a move higher as the Bollinger Bands® open to the upside. The RSI on this timeframe is rising and bullish while the MACD moves higher. There is no weakness in theses charts on either timeframe. There is a Measured Move to 218.90 and an Inverse Head and Shoulders price objective to at least 222.70 before the target mentioned earlier. Support lower comes at 217 and 215.70 followed by 215 and 214 then 213. Continued Uptrend.
SPY Weekly
Heading into the dog days of August the equity markets look strong. Elsewhere look for Gold to continue lower short term in the uptrend while Crude Oil bounces in the downtrend. The US Dollar Index looks to continue higher in the broad consolidation while US Treasuries are biased lower. The Shanghai Composite looks to continue to move sideways in a narrow range while Emerging Markets continue higher.
Volatility looks to remain at extremely low levels keeping the bias higher for the equity index ETF’s SPY, IWM and QQQ. Their charts agree on both the daily and weekly timeframe. If you ranked them the QQQ might be the most ready for a pause or retrench, possibly handing the baton to the IWM. Use this information as you prepare for the coming week and trad’em well.
The information in this blog post represents my own opinions and does not contain a recommendation for any particular security or investment. I or my affiliates may hold positions or other interests in securities mentioned in the Blog, please see my Disclaimer page for my full disclaimer.
