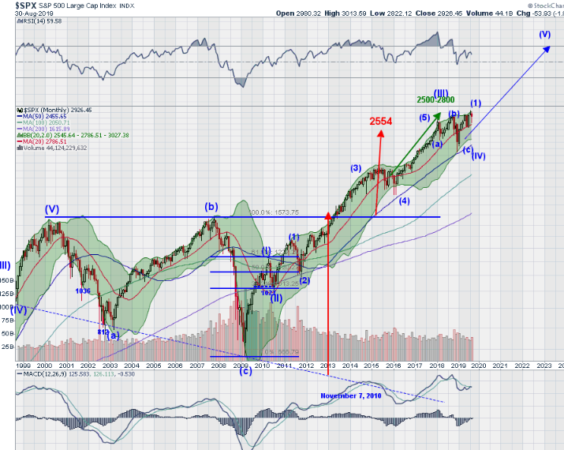
Last week’s review of the macro market indicators saw heading into the last week of August that the equity markets had taken another body blow and were back at support. Elsewhere looked for Gold ($GLD) to continue in its uptrend while Crude Oil ($USO) continued to move lower. The US Dollar Index ($DXY) looked to continue to drift higher while US Treasuries ($TLT) were pausing in their uptrend.
The Shanghai Composite ($ASHR) was giving a short term reversal higher while Emerging Markets ($EEM) continued to the downside. Volatility ($VXXB) continued to creep up keeping the bias lower for the equity index ETF’s $SPY, $IWM and $QQQ. Their charts also showed the SPY (NYSE:SPY) and QQQ continued to move in tandem with the IWM weaker and lower. This has persisted since the December low.
The week played out with Gold consolidating in a narrow range while Crude Oil found support and reversed higher before profit taking Friday. The US Dollar marched higher all week, closing at a new high while Treasuries consolidated at all-time highs. The Shanghai Composite held in a tight range over the 20 day SMA while Emerging Markets moved higher to test a possible reversal.
Volatility held in a tight range mainly in the high teens, shifting the bias to neutral for equities. The Equity Index ETF’s started the week holding their ground and then started to rise by mid-week. By Friday they had retraced the drop from the previous Friday. What does this mean for the coming week? Let’s look at some charts.

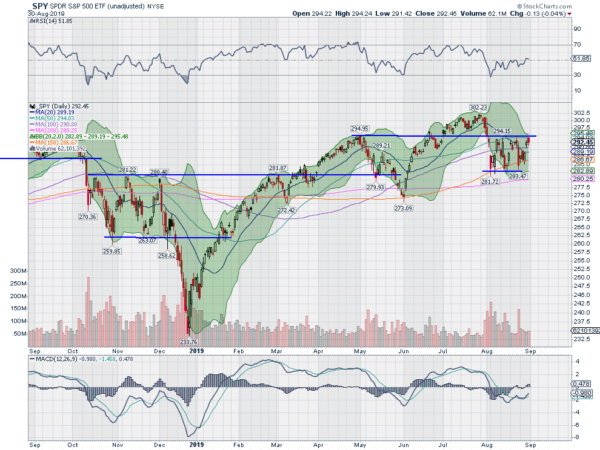
SPY (NYSE:SPY) Daily, $SPY
The SPY (NYSE:SPY) had just pulled back from a move up to resistance near the 50 day SMA as the week began. It had found support at a slightly higher low and then Monday made an inside candle. Tuesday and Wednesday battled to cross the 20 day SMA to no avail, with price sticking in a tight range.
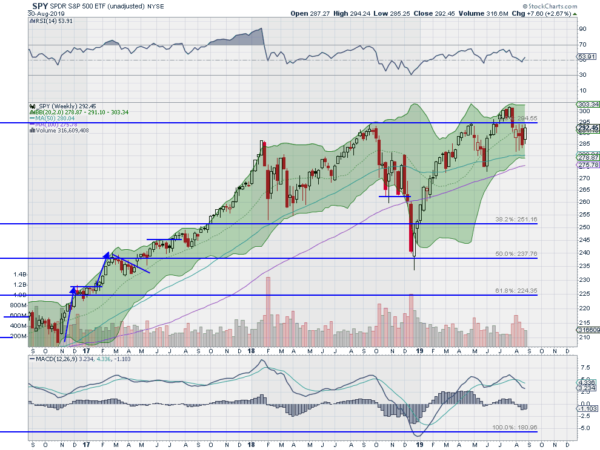
Thursday it jumped higher and Friday retouched that 50 day SMA and resistance before pulling back. The daily chart shows the RSI is flat just over the mid line, neither bullish nor bearish, with the MACD crossed up and rising but negative. The weekly chart shows the consolidation under the important 294.50 level that was resistance twice before and has also acted as support.
The price action also shows a higher low forming after a higher high. The RSI is rising off of the mid line with the MACD leveling after pulling back and positive. There is resistance at 294.50 and 296.50 then 298.80 and 300 before 302.25. Support lower comes at 292 and 290 then 287 and 285 before 284 and 282. Consolidation in Pullback.
SPY (NYSE:SPY) Weekly, $SPY

As the books are closed on August Equity investors and traders are saying good riddance. Elsewhere look for Gold to pause in its uptrend while Crude Oil works a short term bounce in its downtrend. The US Dollar Index continues to be strong while US Treasuries consolidate in their uptrend. The Shanghai Composite continues a short term move higher in the downtrend while Emerging Markets consolidate in the downtrend.
Volatility looks to remain slightly elevated keeping some pressure on the equity index ETF’s. The SPY (NYSE:SPY) and QQQ continue to look stronger than the IWM as they consolidate in a pullback while the IWM shows signs of leaking lower. Use this information as you prepare for the coming week and trad’em well.
Disclaimer: The information in this blog post represents my own opinions and does not contain a recommendation for any particular security or investment. I or my affiliates may hold positions or other interests in securities mentioned in the Blog, please see my Disclaimer page for my full disclaimer.
