A weekly excerpt from the Macro Review analysis sent to subscribers on 10 markets and two timeframes.
Last week’s review of the macro market indicators noted heading into the first full week of August that equity markets were settling and marking time near their highs. Elsewhere gold looked to pause or pullback while crude oil paused with a bias higher. The US Dollar Index was slowing in its descent while US Treasuries were broadly consolidating.
The Shanghai Composite looked to continue in its uptrend while Emerging Markets paused in their uptrend. Volatility looked to remain at very low levels keeping the bias higher for the equity index ETF’s SPY (NYSE:SPY), IWM and QQQ. Their charts showed consolidation in the SPY and QQQ with a pullback in the the rising channel for the IWM.
The week played out with gold starting the week lower and then reversing to the upside while crude oil met sellers and stalled at the 200 day SMA. The US dollar bounce in the downtrend stalled while Treasuries (TLT) moved up to a higher high. The Shanghai Composite stalled at resistance and then pulled back slightly while Emerging Markets (EEM) pulled back from a first touch at resistance.
Volatility started the week in hand but crept higher til a spike Thursday into the teens, still low but changing the short term bias for equities to lower. The Equity Index ETF’s started the week in consolidation but then the $IWM led them lower starting Tuesday. The SPY and QQQ joined the move lower Wednesday and all continued Thursday before finding some footing Friday. What does this mean for the coming week? Lets look at some charts.
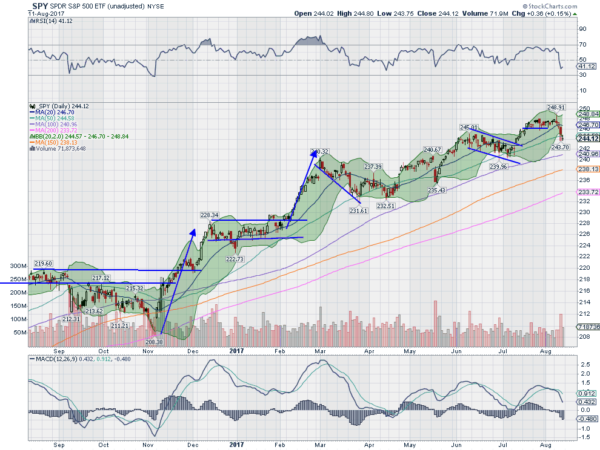
SPY Daily, SPY
The SPY started the week like it ended the last one, in a tight range. Tuesday saw a bearish engulfing candle with a pullback Wednesday to the 20 day SMA. Thursday it printed a strong bearish candle, moving outside of the Bollinger Bands and under the 50 day SMA. It consolidated there to end the week lower Friday. The daily chart shows the push lower under support for the last 4 weeks, but stopping short of the prior low. The RSI is holding at the lower edge of the bullish zone while the MACD is crossed down and falling.
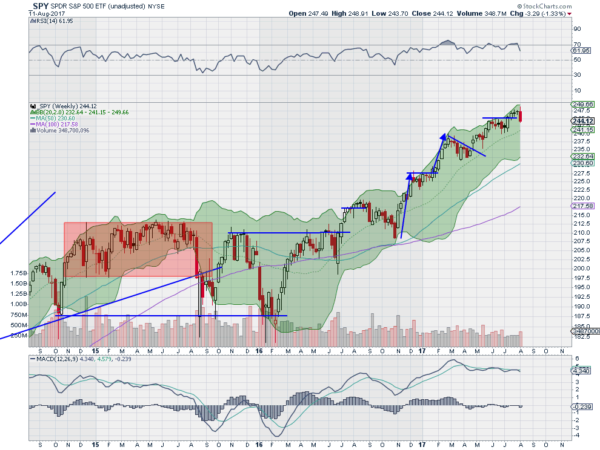
On the weekly chart the strong red candle after two doji weeks bodes for more downside. The RSI is strong and bullish but pulling back while the MACD is pulling back. There is resistance at 245 and 246 followed by 248 and a Measured Move to 253 above. Support lower comes at 242 and 240 followed by 238 and 237.10. Consolidation or Pullback in the Uptrend.
SPY Weekly, SPY
Heading into August Options Expiration the equity markets are showing some signs of tiring, especially the IWM. Elsewhere look for gold to continue higher while crude oil consolidates at resistance. The US Dollar Index bounce may be over while US Treasuries are biased higher in the short run. The Shanghai Composite and Emerging Markets are both looking better to the downside short term in their uptrends. spy
Volatility has crept up but may be stretched, but worth paying closer attention to it in the short run. This changes the bias to lower for the equity index ETF’s SPY, IWM and QQQ. Their charts all show some signs of weakness in the short term, especially the IWM, but less weakness longer term especially the QQQ. Use this information as you prepare for the coming week and trad’em well.
The information in this blog post represents my own opinions and does not contain a recommendation for any particular security or investment. I or my affiliates may hold positions or other interests in securities mentioned in the Blog, please see my Disclaimer page for my full disclaimer.
