Last week’s review of the macro market indicators which with April Expiry behind saw the Equity markets had held strong and looked to have started back higher. Elsewhere looked for gold (NYSE:GLD) to consolidate while crude oil (NYSE:USO) consolidated but with a bias to the upside. The US Dollar Index (NYSE:UUP) was testing the bottom of the consolidation range while US Treasuries (NYSE:TLT) looked to move higher.
The Shanghai Composite (NYSE:ASHR) and Emerging Markets (NYSE:EEM) looked strong and ready to go higher the with risk of Emerging Markets running in place a bit longer. Volatility looked to remain subdued keeping the bias higher for the equity index ETFs SPDR S&P 500 (NYSE:SPY), iShares Russell 2000 (NYSE:IWM) and PowerShares QQQ Trust Series 1 (NASDAQ:QQQ). Their charts also looked better to the upside with the weekly charts looking strong.
The week played out with gold starting higher but pulling back lower to end the week while crude oil started rebounded higher on the week. The US dollar moved slightly lower before a bounce but still at the bottom of the range while Treasuries broke support and moved lower. The Shanghai Composite pushed lower on the week while Emerging Markets started with a gap higher but gave it all back and some by Friday.
Volatility made a new eight month low before rebounding slightly, still at very low levels. The Equity Index ETFs showed some signs of rotation on the week, with the SPY and IWM leading higher early then the SPY giving some back and the QQQ which was flat most of the week joining to the downside Friday. What does this mean for the coming week? Lets look at some charts.
SPY Daily
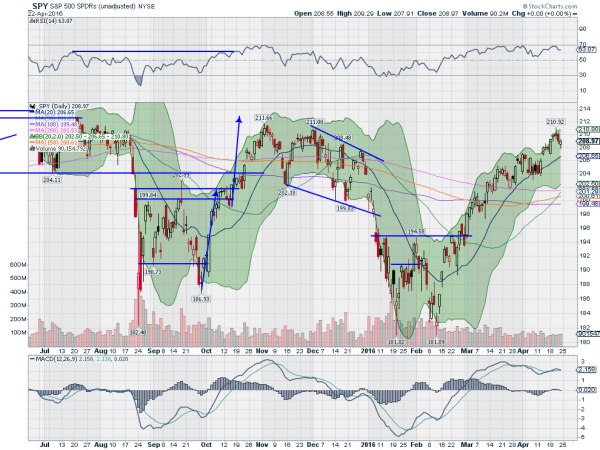
The SPY started the week with a Marubozu candle to the upside Monday and followed through higher Tuesday. It spiked higher Wednesday but fell back printing a possible Shooting Star reversal. This confirmed to the downside Thursday, but started showing signs of buying Friday with a bit of a lower shadow.
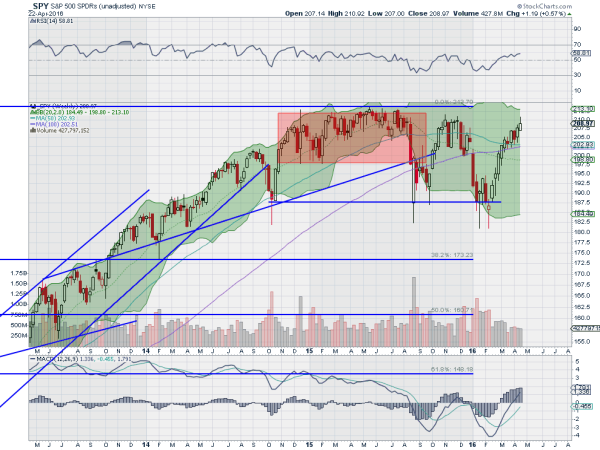
At the end of the week the SPY was up 0.57%, holding over its 20 day SMA. The daily chart shows the 50 day SMA about to cross up through the 200 day SMA, a bullish Golden Cross. The RSI is in the bullish zone and the MACD is trying to cross down, but at positive levels. Still a bullish picture on this timeframe. The weekly chart shows the continuation higher off of the February low.
It is approaching the top made in October and November and just below the all-time highs, showing is first sizable upper shadow on a candlestick. The RSI on this timeframe is slowly rising but has still not crossed 60 into the bullish zone while the MACD is rising. There is resistance at 210.75 and 211.50 before 213 and the all-time high at 213.78. Support lower stands at 208.50 and 207.60 followed by 206 and 204. Possible Short Term Pullback in the Uptrend.
SPY Weekly
Heading into the last week of April the Equity indexes are showing signs of rotation out of the QQQ and SPY and into the IWM. Elsewhere look for gold to consolidate in a $30 range while crude oil continues higher. The US Dollar Index continues to test the bottom of a wide consolidation range while US Treasuries are biased lower. The Shanghai Composite and Emerging Markets are biased to the downside with risk of the Emerging Market longer term uptrend re-exerting itself.
Volatility looks to remain subdued and with a bias lower keeping the bias higher for the equity index ETFs SPY, IWM and QQQ, despite the moves last week. Their charts are mixed with the IWM just strong all around and the SPY strong on the weekly timeframe but with cracks on the daily. The QQQ is the weakest on the daily and shows consolidation on the weekly. Perhaps next week rotates back into the QQQ. Use this information as you prepare for the coming week and trad’em well.
Disclaimer: The information in this blog post represents my own opinions and does not contain a recommendation for any particular security or investment. I or my affiliates may hold positions or other interests in securities mentioned in the Blog. Please see my Disclaimer page for my full disclaimer.
