🥇 First rule of investing? Know when to save! Up to 55% off InvestingPro before BLACK FRIDAYCLAIM SALE

SPY Forming Short-Term Top

Published 09/28/2016, 01:26 PM
Updated 07/09/2023, 06:31 AM
XAU/USD
-
US500
-
SPY
-
GC
-
GDX
-
VIX
-
VIX3M
-
  • Monitoring purposes SPX: Sold long SPX on 9/16/16 at 2139.16 = gain .57%; Long SPX on 9/13/16 at 2127.02.
  • Monitoring purposes Gold: Short GDX on 9/22/16 at 27.75.
  • Long-Term Trend monitor purposes: Short SPX on 1/13/16 at 1890.28
  • SPDR S&P 500

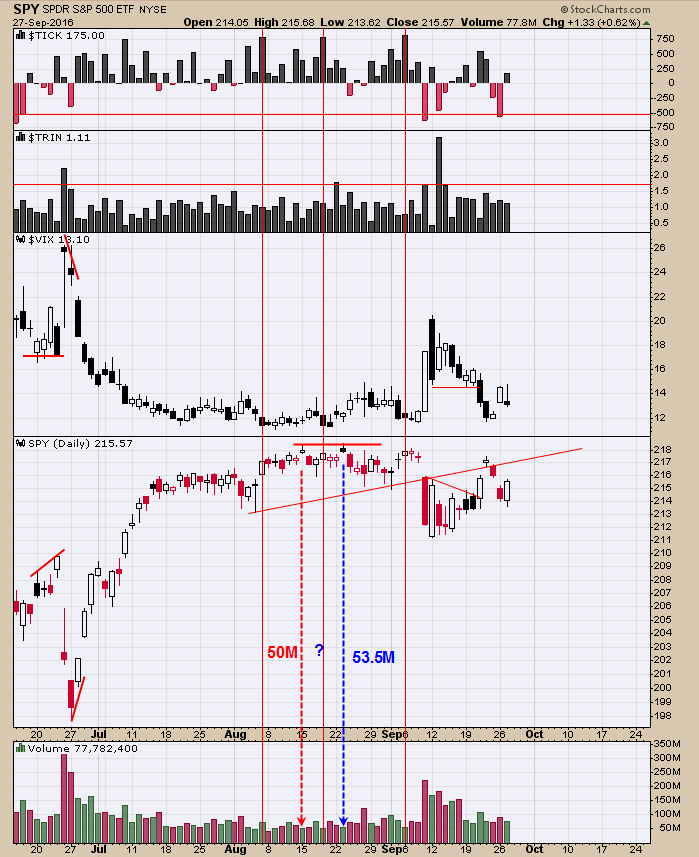
    On August 15, SPDR S&P 500 (NYSE:SPY) made a high on 50 million shares, on August 23 that high was tested on 53.5 million shares. Normally to confirm a high the test is usually on 10% lighter volume. The August 23 test came on 7% increased in volume and suggests at some point that high will be tested again. Another helpful sign that a short term top is forming is for the ticks to close at exhaustion levels above +750. The three red vertical lines show when ticks reached +750 and in each case market is near a high. Signal is unclear here and therefore we will remain on the side lines.
    Volatility

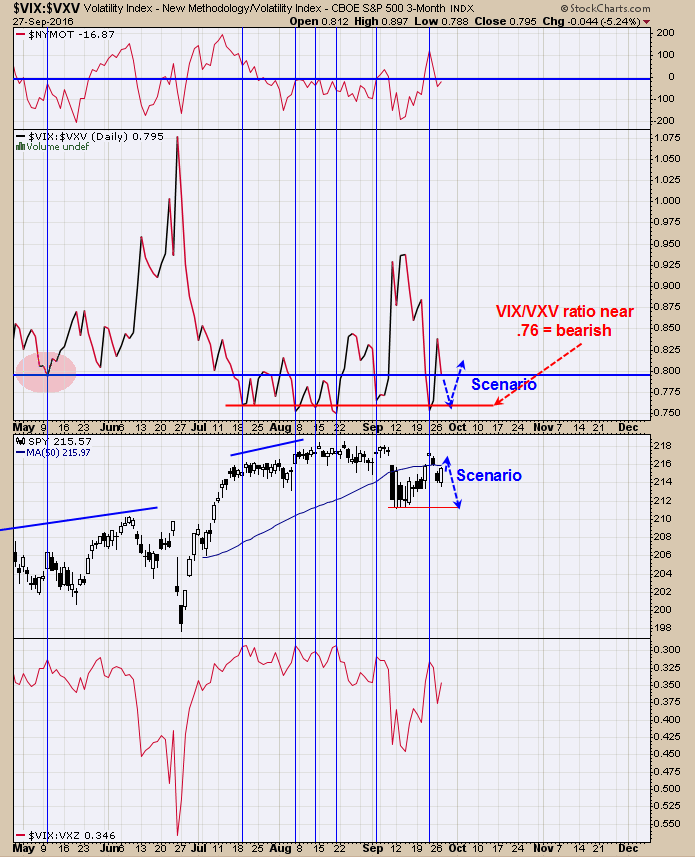
    Above is the VIX/VXV ratio. Since mid July, when this ratio reached .76 or lower the uptrend in the SPY was near and end. In four of these cases the market just trended sideways and two had decent declines. If this ratio manages to test the .76 range again will suggests the uptrend is near and end. The question will become if the next move will be down or sideways. Market is not giving a lot of information here which usually indicates a sideways market is in progress.
    Gold Miners

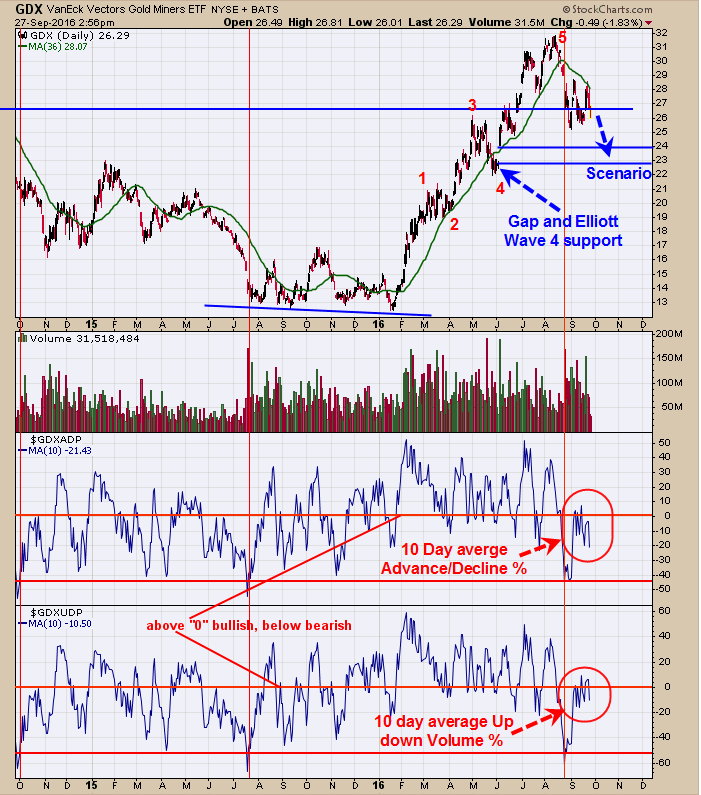
    Bottom window is the 10-day average for the Up down Volume percent and next window up is the 10-day average for the Advance/Decline percent which is quicker than yesterday’s 18-day average for these indicators. Though it shows more wiggles, it useful in recognizing potential reversals sooner. Yesterday’s decline in GDX shows both Percent indicators in bearish territories and keeps the trend bearish for now. When a market finishes an Elliott five wave up, its common for the correction to retrace back to the previous Elliott wave 4 low, which is near 22 on GDX. There is also a gap near this range which adds strength to this support area. Short GDX on 9/22/16 at 27.75.

Latest comments

Loading next article…
Risk Disclosure: Trading in financial instruments and/or cryptocurrencies involves high risks including the risk of losing some, or all, of your investment amount, and may not be suitable for all investors. Prices of cryptocurrencies are extremely volatile and may be affected by external factors such as financial, regulatory or political events. Trading on margin increases the financial risks.
Before deciding to trade in financial instrument or cryptocurrencies you should be fully informed of the risks and costs associated with trading the financial markets, carefully consider your investment objectives, level of experience, and risk appetite, and seek professional advice where needed.
Fusion Media would like to remind you that the data contained in this website is not necessarily real-time nor accurate. The data and prices on the website are not necessarily provided by any market or exchange, but may be provided by market makers, and so prices may not be accurate and may differ from the actual price at any given market, meaning prices are indicative and not appropriate for trading purposes. Fusion Media and any provider of the data contained in this website will not accept liability for any loss or damage as a result of your trading, or your reliance on the information contained within this website.
It is prohibited to use, store, reproduce, display, modify, transmit or distribute the data contained in this website without the explicit prior written permission of Fusion Media and/or the data provider. All intellectual property rights are reserved by the providers and/or the exchange providing the data contained in this website.
Fusion Media may be compensated by the advertisers that appear on the website, based on your interaction with the advertisements or advertisers.
© 2007-2024 - Fusion Media Limited. All Rights Reserved.