Investing.com’s stocks of the week
This is a follow-up analysis to the article I wrote back in March 26th, 2018, titled, Be Greedy When Others Are Fearful when SPDR S&P 500 (NYSE:SPY) was trading at 265.
COMPARISON
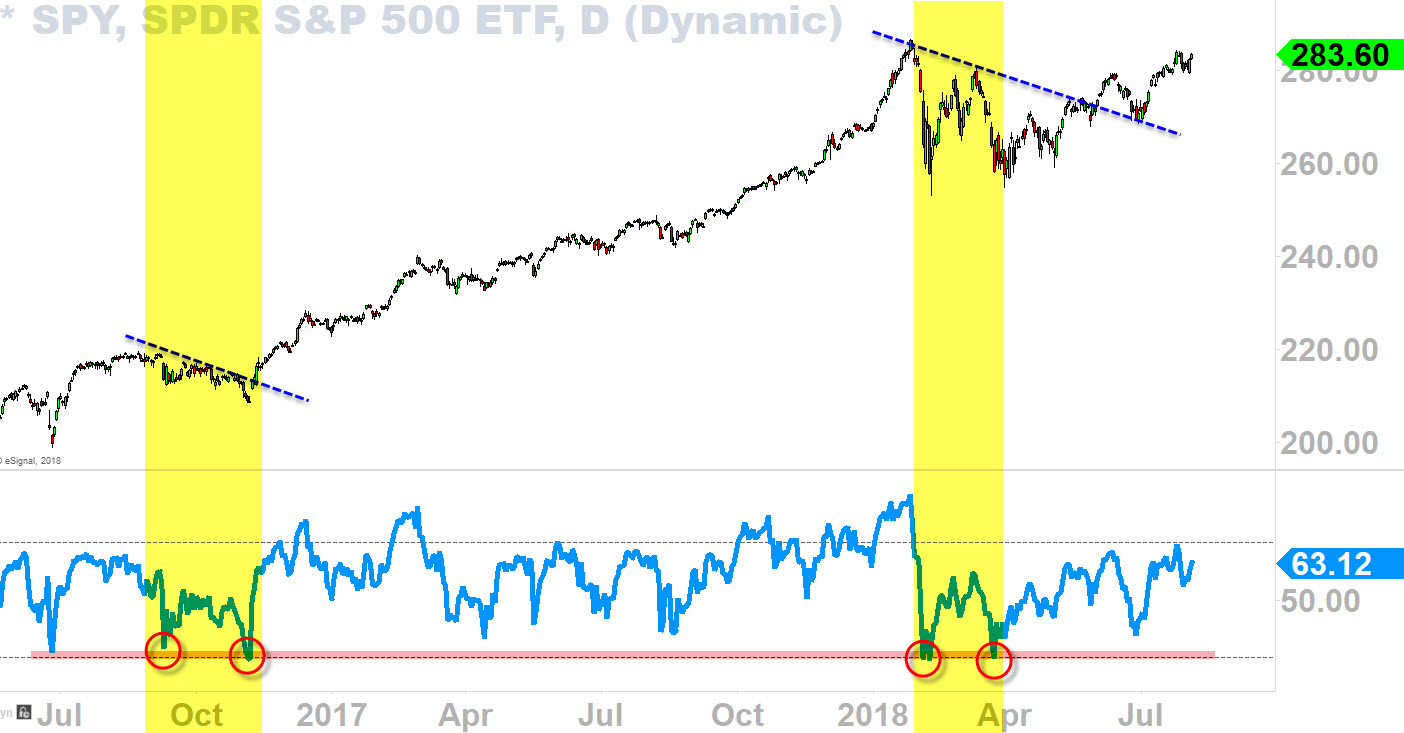
Below chart (daily) is the updated chart to the previous chart (click here to see the original), and since the late March we can see that Market has been faithfully cultivating higher lows breaking above the downtrend resistance (blue dotted line). This was what I was looking for back in March when I wrote the article, that it would clear above the downtrend resistance and stay above it (and we are doing that currently). I think the key point of this chart is, the bottom indicator, which is the RSI indicator--we have not yet gotten into the 'overbought' territory (still hovering in the middle part of the band) despite the fact that the SPY is almost near an all-time high. It means there is more room to move to the upside as I am targeting 300 as my next target on SPY.

OVERALL TREND
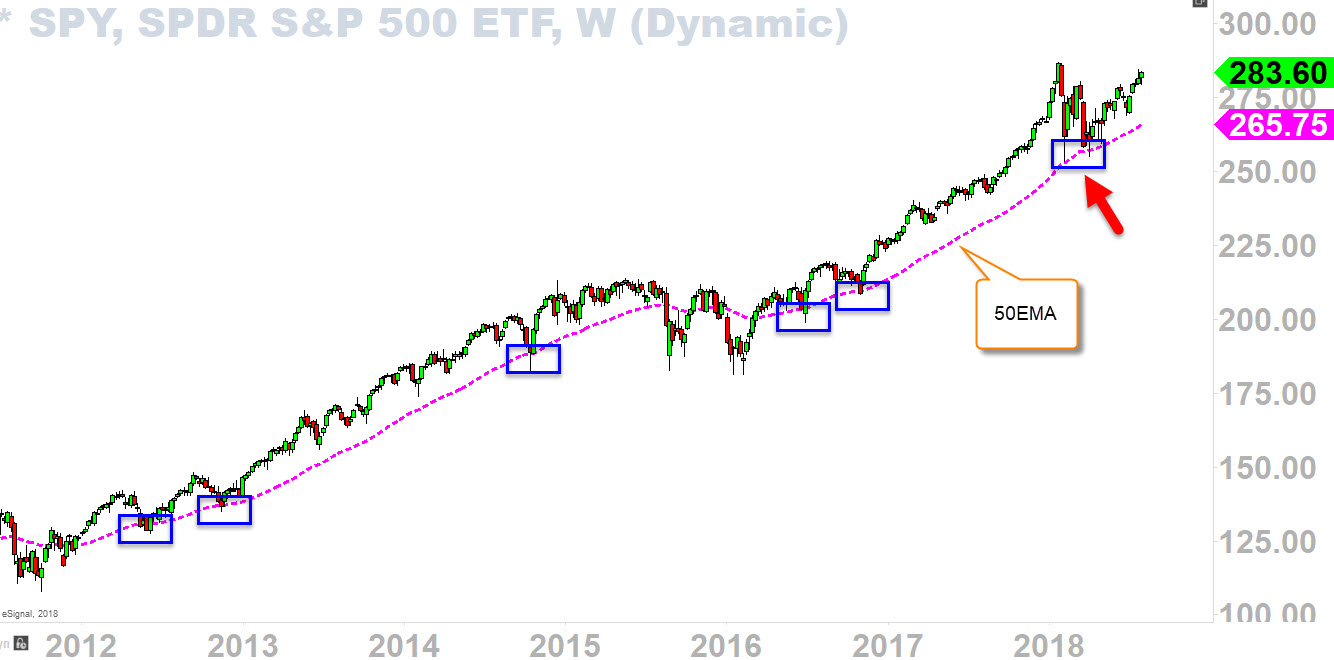
Below chart (weekly) is the updated chart to the previous chart (click here to see the original) as we can clear see that "50EMA" acted as strong support, yet again, just so perfectly (arrow) back in March. Most traders are either impatient or so fearful that they ignore one of the most basic aspect of trading--moving average. I specially highlighted this "50EMA" on my last article because its been acting as a strong support since 2012 (see blue boxes) and therefore I wanted to give benefit of the doubt that it COULD continue to do so. And that favor of the doubt played out well for bulls (once again) in this case.

Rising-Uptrend Support
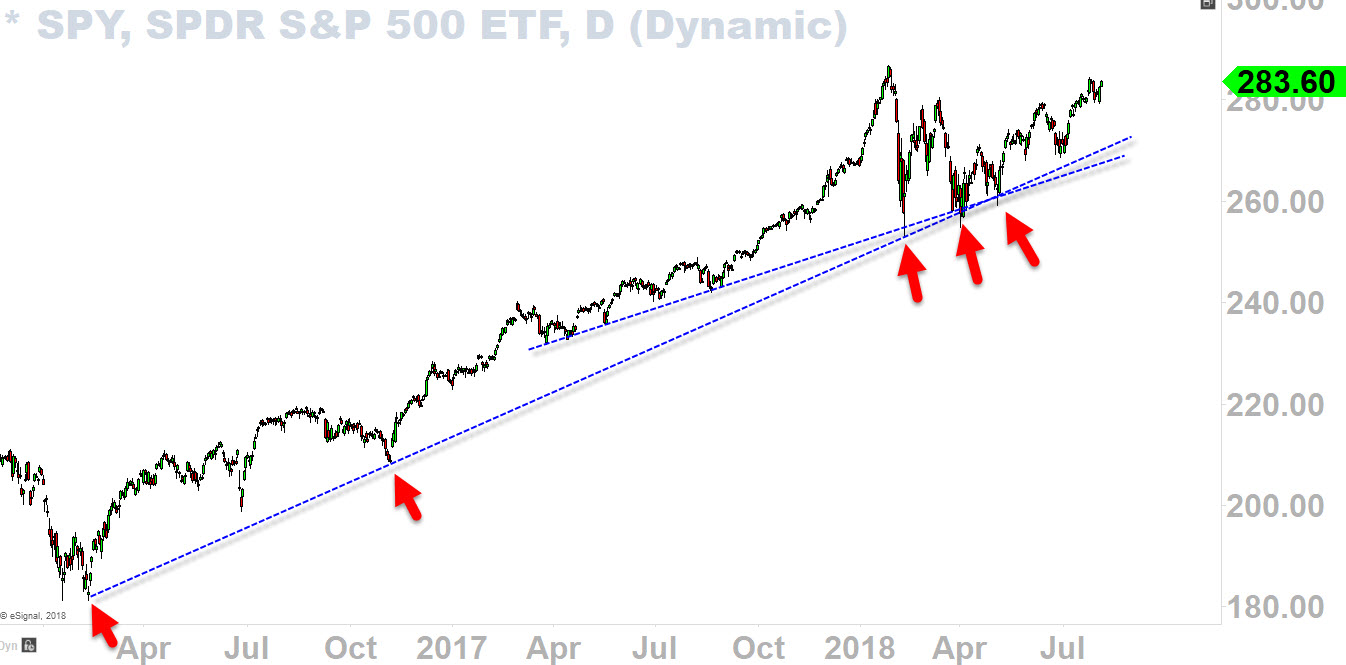
Below chart (daily) is the updated chart to the previous chart (click here to see the original). I actually thought we are going to break below this rising-uptrend support to create bigger panic and fear before going right back up, but this time around, market perfectly respected this rising-uptrend support. This is as basic as you are going to get. Many times we don't have this kind of luxury where the market respects the rising-uptrend support so perfectly like this. I feel like most traders know and understand the concept of uptrend, yet when the market starts to shake they all lose their mind fearing the worst.
If you calmly study these charts, the previous ones and the present ones, it was not hard to identify the current state of mind even back in March (that the trend was still up and the market deserved to be given the benefit of the doubt on that uptrend). It's always hard to go through the shaky market when it's happening, but as you look back, you can clearly see that it was no need for panic but look for opportunities--"be greedy when others are fearful, be fearful when others are greedy." I don't always know exactly how things are going to play out but I visioned that the market was going to play out something like this because we were and are still in a primary-term uptrend.

