First-quarter earnings are coming in strong, but stocks are stuck in a rut. There is room to rally near term, with tons of overhead resistance.
One common complaint among the bulls is that US stocks of late have failed to follow earnings higher. There is some truth to that.
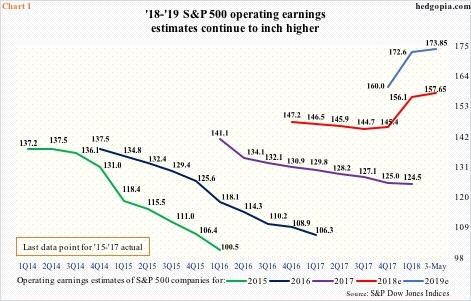
Post-tax cuts, estimates for both this year and next rocketed higher. The Tax Cuts and Jobs Act of 2017 was signed into law on December 22 last year. A day prior, operating earnings estimates for 2018 stood at $145.31. Last Thursday, they were $157.65 – a new high. Ditto with 2019 estimates – currently at $173.85. In 2017, these companies earned $124.52. If estimates come through, earnings would have grown a whopping 26.6 percent this year, and another 10.3 percent next. With 84 percent reporting, 1Q18 earnings (blended) are up an unreal 28.6 percent!
Yet, the S&P 500 large cap index is down 0.4 percent year-to-date. From the all-time high of 2872.87 on January 26, it is down 7.3 percent. The index jumped 19.4 percent last year, so it could very well be digesting those gains. Or, other factors could be in play.
For one, the massive jump in earnings estimates this year and next does not owe much to jump in productivity.
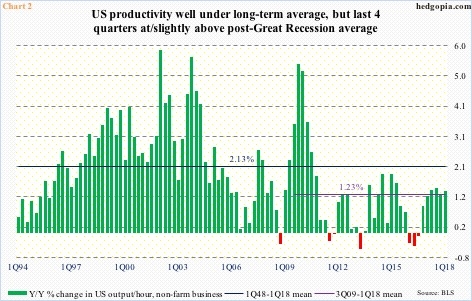
Nonfarm output per hour in 1Q18 increased 1.34 percent in the 12 months to March. This is much weaker than the long-term average of 2.13 percent going all the way back to 1Q48. The suppressed nature of productivity is not some recent phenomenon.
Post-Great Recession, productivity has been very anemic, averaging a mere 1.23 percent. In the last four quarters, year-over-year productivity has grown at or slightly above the cycle average, coming on the heels of seven straight quarters of underperformance, three of which were in negative territory (Chart 2).
This lends credence to those not believing in sustainability of the current pace of earnings upward revision.
Another aspect to this story lies in data that is showing the economy is beginning to decelerate from a decent pace.
Real GDP grew 2.3 percent in 1Q18, versus 2.9 percent in 4Q17, and 3.2 percent and 3.1 percent before that.
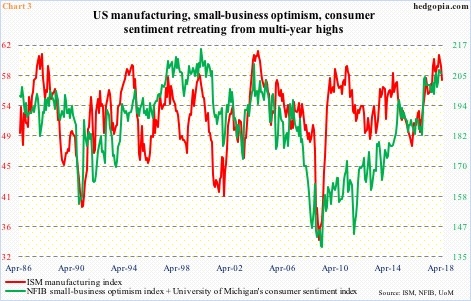
Chart 3 plots the ISM manufacturing index with the NFIB small-business optimism index combined with University of Michigan’s consumer sentiment index. They are all at multi-year highs.
Manufacturing activity dropped a couple of points month-over-month in April to 57.3. February’s 60.8 was the highest since May 2004. Similarly, small-business optimism fell 2.9 points m/m in March, with February’s 107.6 the second highest in its history (monthly surveys go back to 1986). And consumer sentiment fell 2.6 percentage points m/m in April to 98.8. March’s 101.4 was the highest since January 2004.
The point is, there is plenty of room for these metrics to continue lower. In this scenario, how reliable is the growth assumption baked into the aforementioned earnings estimates?
Amidst all this, corporations are pulling back from their hitherto aggressive pace of bond issuance.
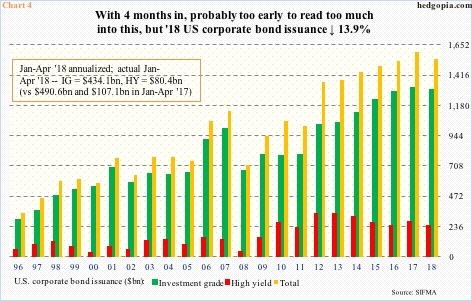
In the first four months, corporate bond issuance totaled $514.5 billion, made up of $434.1 billion in investment-grade and $80.4 billion in high-yield. This compares with $597.8 billion ($490.6 billion investment-grade and $107.1 billion high-yield) in the corresponding period last year.
The year is only one-third over, so things can always change, but if the current pace sustains, we are looking at total issuance down 13.9 percent this year. Both investment-grade and high-yield are down, but the latter is down a lot more, down 25 percent versus down 11.5 percent for investment-grade.
High-yield issuance can be used to measure markets’ risk-on pulse. Secondly, reduction in total issuance can reverberate through capital expenditures and stock buybacks, among others. Thirdly, short rates are still below yields on the long end of the curve. In normal circumstances, it is still advantageous for corporations to issue debt, unless they fear inversion.
Speaking of risk, US stocks are at a critical juncture.
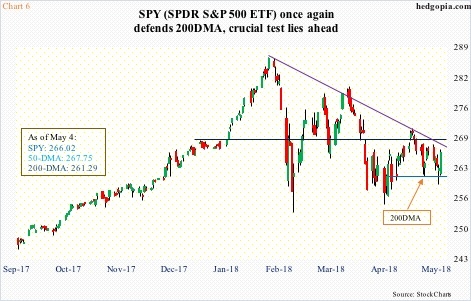
After peaking late January, major indices are more or less caught in no-man’s land. They took a beating in February and March, with several tests of the 200-day moving average on the S&P 500, for instance. The average is yet to give way, but at the same time the index has not been able to lift off of it.
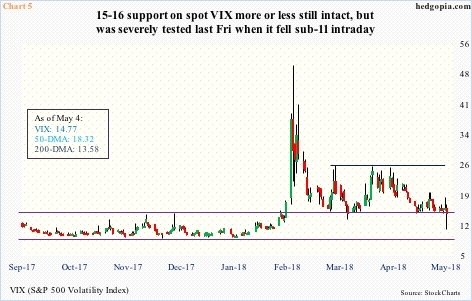
Spot VIX reflects this bull-bear push and pull. It shot up to 50.30 intraday early February. The subsequent drop saw volatility bulls more or less defend 15-16 support, with an intraday drop sub-11 last Friday.
Non-commercials, who have been net long VIX Futures for 13 straight weeks, have been cutting back their holdings (more here). Continuation of this trend can mean the door to low-teens, or low double-digits, is now open on the cash.
In this scenario, SPDR S&P 500 ETF (NYSE:SPY) can at least go test a confluence of resistance above. At $268 lies trend-line resistance from January 26 when the ETF ($266.02) peaked at $286.63. The 50-day lies at $267.75, the daily upper Bollinger® band at $270.35. Plus, there is horizontal resistance at $269 (Chart 6).
Both Thursday and Friday last week, the bulls once again defended the 200-day. The daily chart has room to head higher.
This probably sets up an opportunity to at least sell some out-of-the-money puts. Hypothetically, May 18th SPY 263 puts bring in $1.46. It is naked, so if put, it is a long at $261.54, near last Friday’s low.
If the underlying rallies to the aforementioned resistance and then hesitates, this can later be turned into a short strangle, further adding to premium.
Thanks for reading.

