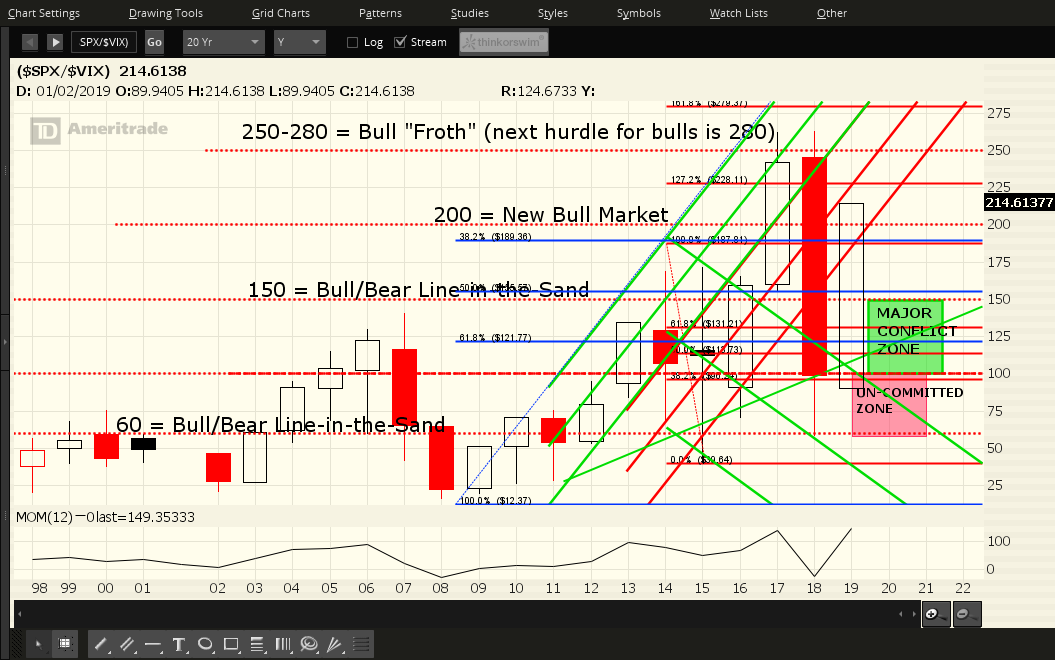
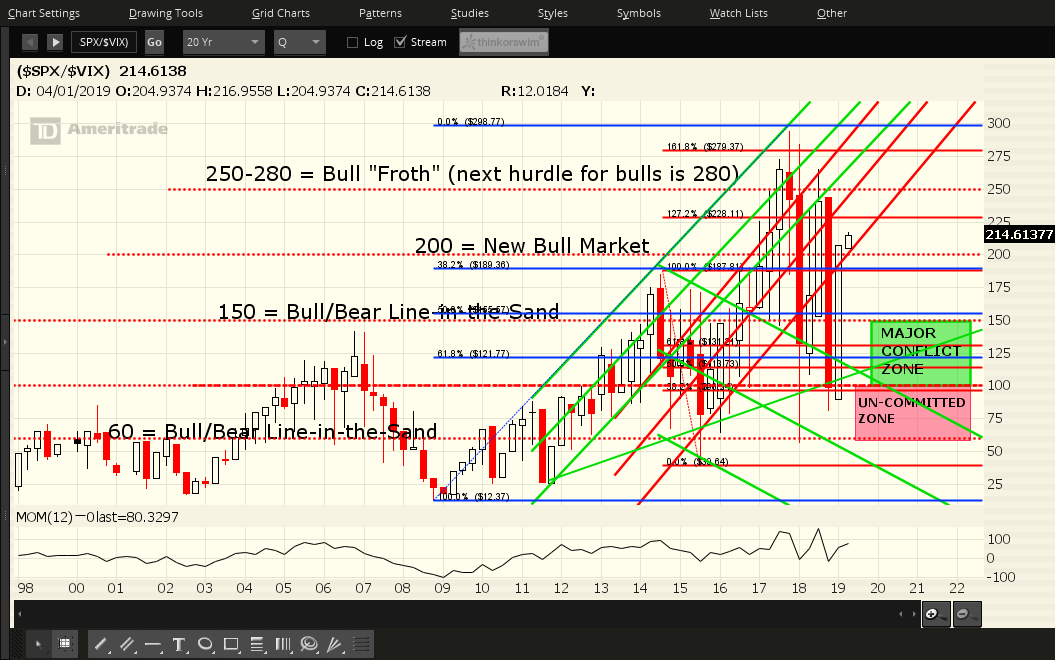
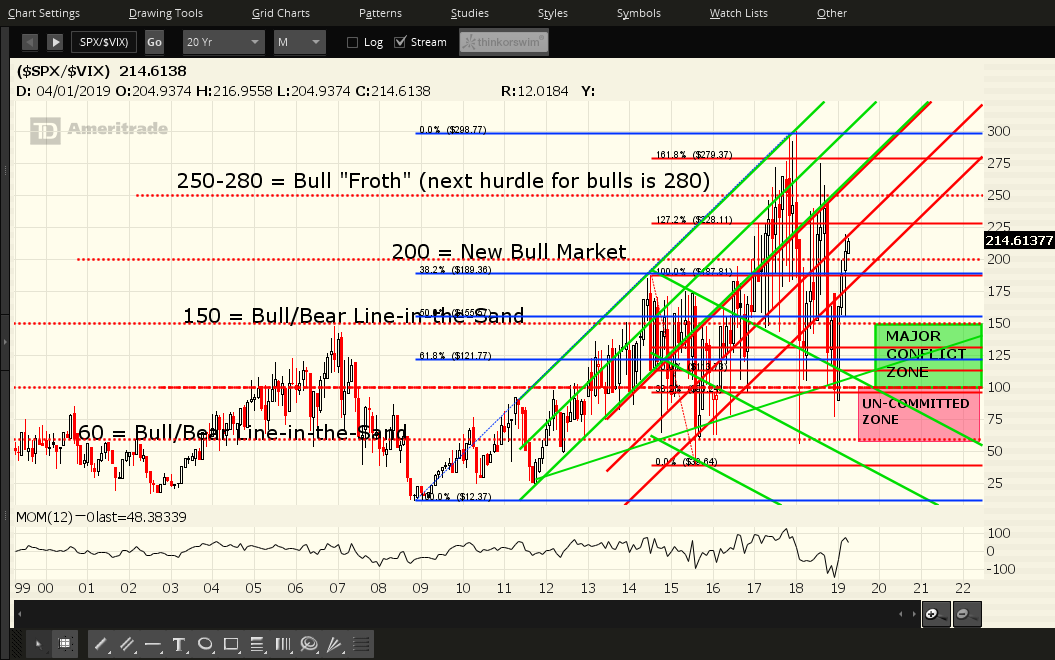
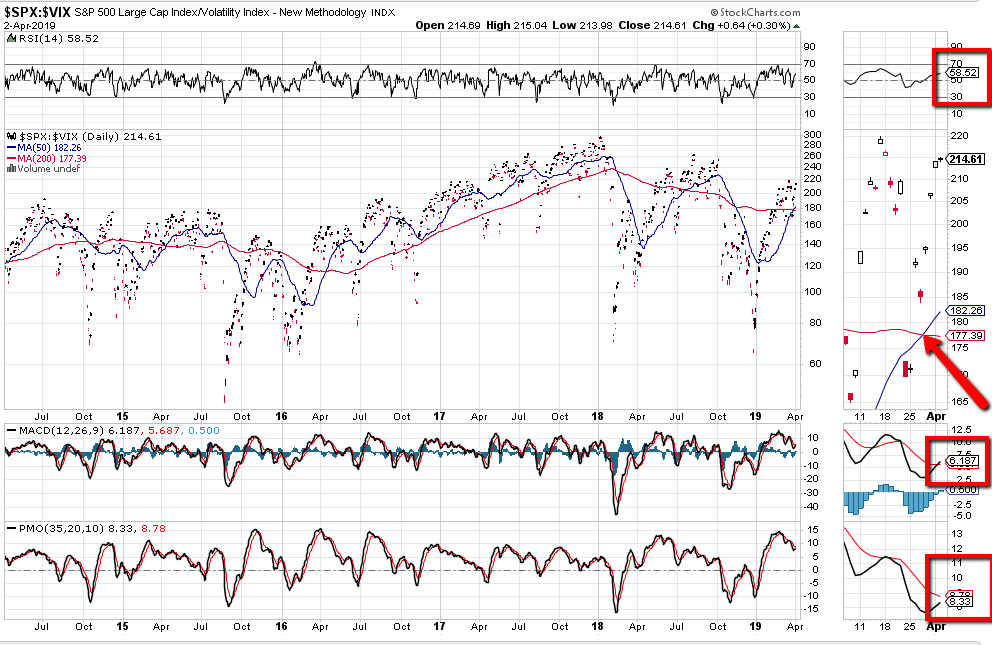
Take a look at the following charts of the SPX:VIX ratio. Appearing in order,
- each candle on the first chart represents a period of one year,
- each candle on the next represents a period of one quarter,
- each candle on the next represents a period of one month, and
- each candle on the last represents a period of one day.
For the third day in a row, price closed on Tuesday above what I've called the 200 "New Bull Market" level since it first broke through during the first week in 2017. It still has a way to go before it runs into the 250-280 "Bull Froth Zone," where we've seen traders/investors spike the price first, then take profits in the SPX since then, beginning in May 2017.
Simply put, judging from the extremely bullish bias of the candle formations and the bullish signals of the technical indicators on all four charts and timeframes, I see no reason for this ratio not to retest this 250-280 "Bull Froth Zone" over the coming days/weeks. This means that the SPX will likely retest its prior all-time high of 2940.91, or spike higher at some point...provided that the SPX:VIX ratio holds above the 200 "New Bull Market" level.
In the short term, look for a bullish crossover (a "BUY" signal) to form on the PMO indicator on the daily chart, for the new bullish crossover (a "BUY" signal) to hold on the MACD, for the RSI to hold above 50 (a "BUY" signal), and for the recent bullish moving average Golden Cross formation (a "BUY" signal) to hold should the ratio price continue to rally, to support/confirm any higher prices in the SPX. Otherwise, we may see, either a period of sideways consolidation or a pullback in the SPX (depending on how skittish traders/investors are feeling), until it makes its next move to, potentially, new highs.
As an aside, the bullish comments referenced in my post of March 26 on U.S. 2-5-10-30-Year Bonds, still apply. As the level of market skittishness increases on SPX higher prices, no doubt, we'll see monies continue to flow into Bonds, possibly at an elevated rate...another clue to monitor for evidence of slowing enthusiasm for equities giving way to a growing demand for Bond hedging.


