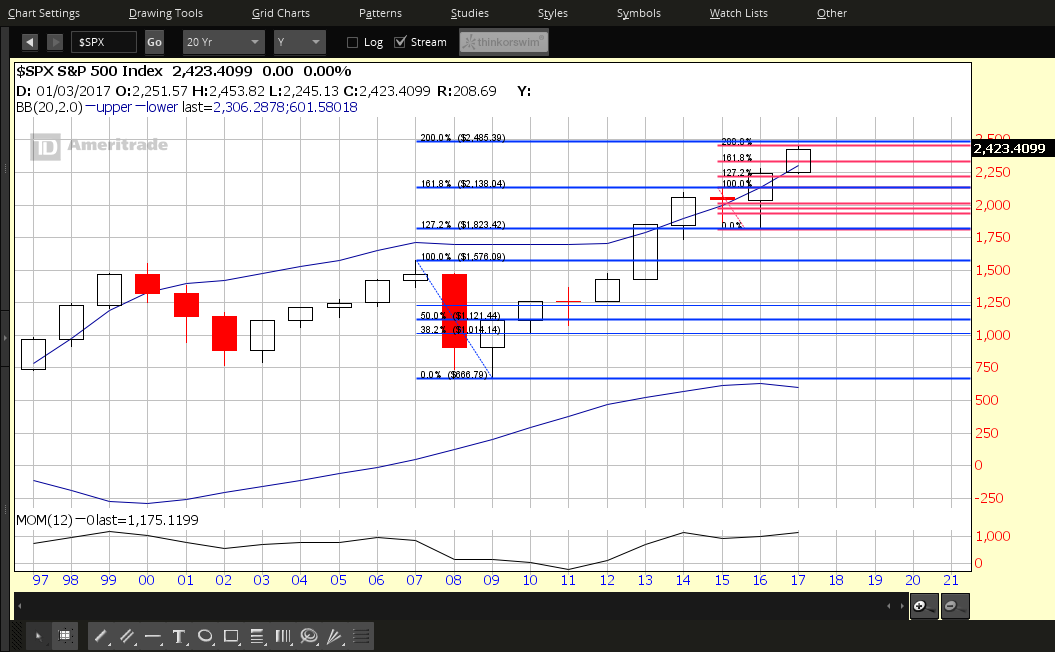
Each candle represents a period of one year on the following yearly chart of the SPX.
So far, this year's candle is a bit less than half of 2016's trading range and the momentum indicator is almost as high as it was in 2014 (this year's trading range is about 60% as high as 2014's).
What this tells me is that, on an annual basis, 2017 is fairly strong at this point and could perform well in the latter half of the year.

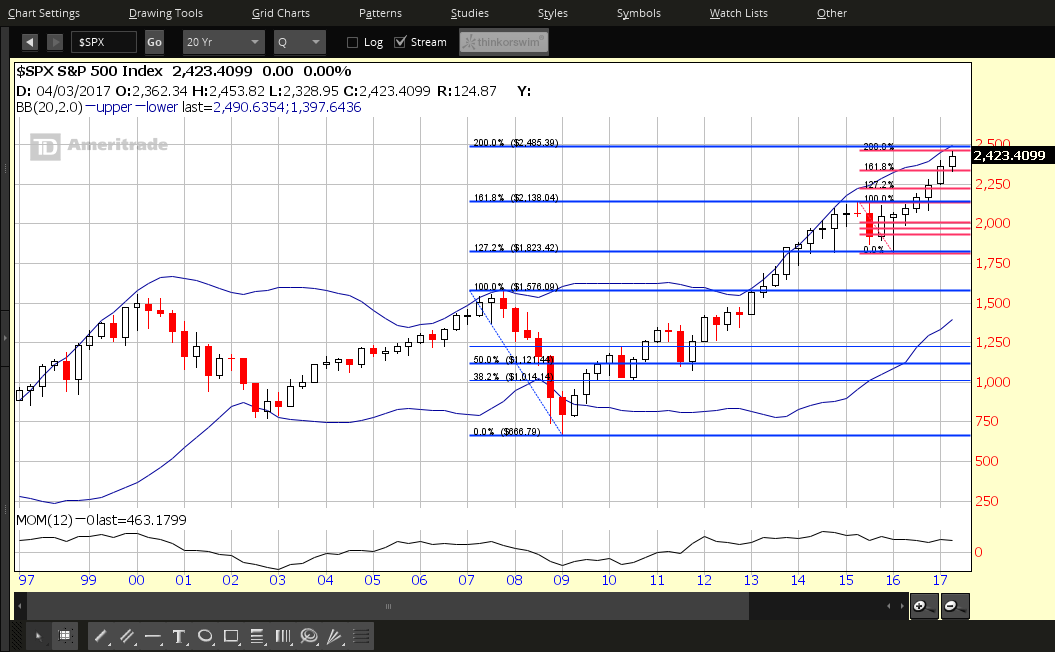
Each candle represents a period of one quarter on the following quarterly chart of the SPX.
The trading range of this year's Q2 candle (which closed last Friday) is about 80% of Q1's range. While the momentum indicator on this timeframe has been in a moderate downtrend since mid-2014, it rose in Q1 and has dropped a bit in Q2.
So, on a quarterly basis, I'd track the next candle to see whether momentum can surpass and hold beyond that achieved in Q1 and whether Q3's trading range exceeds that of Q2 to indicate firm bullish conviction (assuming that price continues to advance higher).

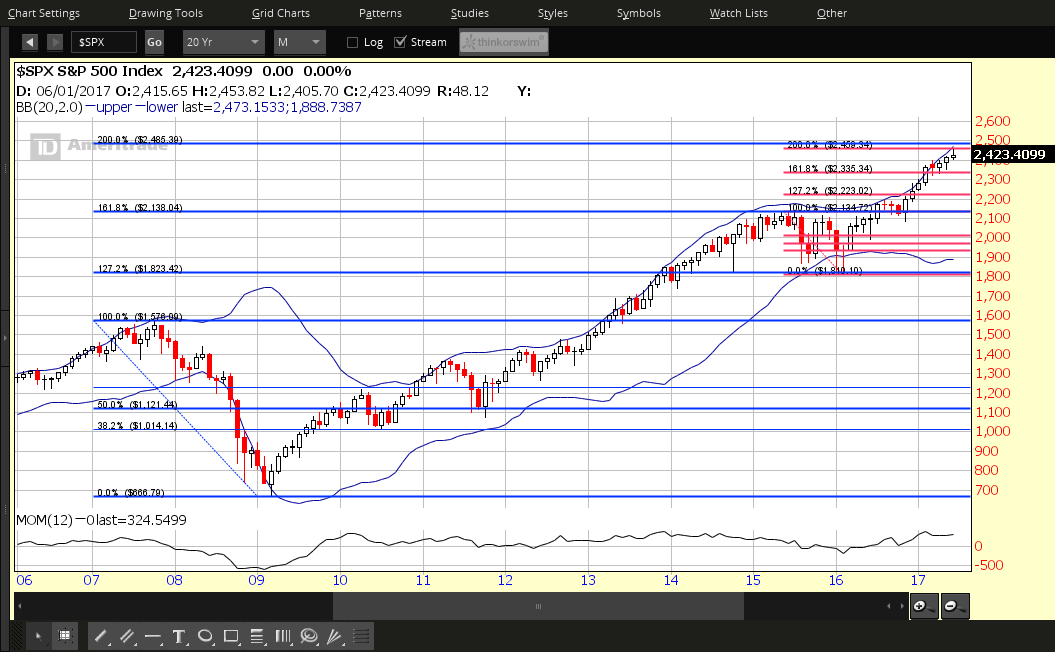
Each candle represents a period of one month on the following monthly chart of the SPX.
The trading range of June's candle is about 72% of May's and is a "shooting star" (which is, generally, a bearish signal after a long run-up, such as we've seen since December 2016). Momentum has been flat after dropping in March this year.
However, June's close is higher than May's, so one candle does not necessarily indicate that a trend reversal is imminent. We'd need to see a lower close in July to assess the situation at that time on this monthly timeframe. But, although the close was higher, it was done so by traders with a tepid appetite for equities.

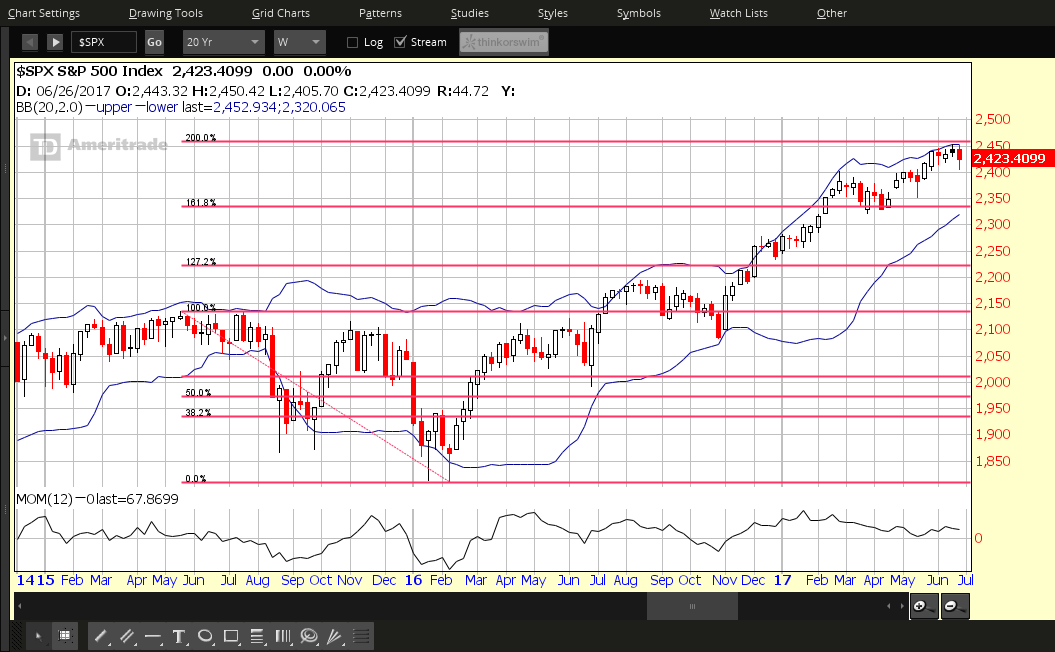
Each candle represents a period of one week on the following weekly chart of the SPX.
Momentum has been falling since the end of January this year and a great deal of profit-taking has been occurring since March. At the same time, this index has been inching upwards to new highs in a roller-coaster manner.
The close of last week's candle was not lower than the close of the May 30th candle, so I would not call the candle formation, since then, a "tower top" reversal. I'm getting mixed signals as to short-term weekly trend, so am reluctant to forecast further weakness ahead, apart from saying that buyers have been unenthusiastic and non-committal, not only in June, but also in May, because of the extensive amount of consolidation occurring during those months.
Keep an eye on momentum over the coming weeks to see if it continues its recent rally on further price advancements, as a confirmation of strengthening buying conviction. Otherwise, we could see a summer selloff ensue, as I described in my post of late June.

