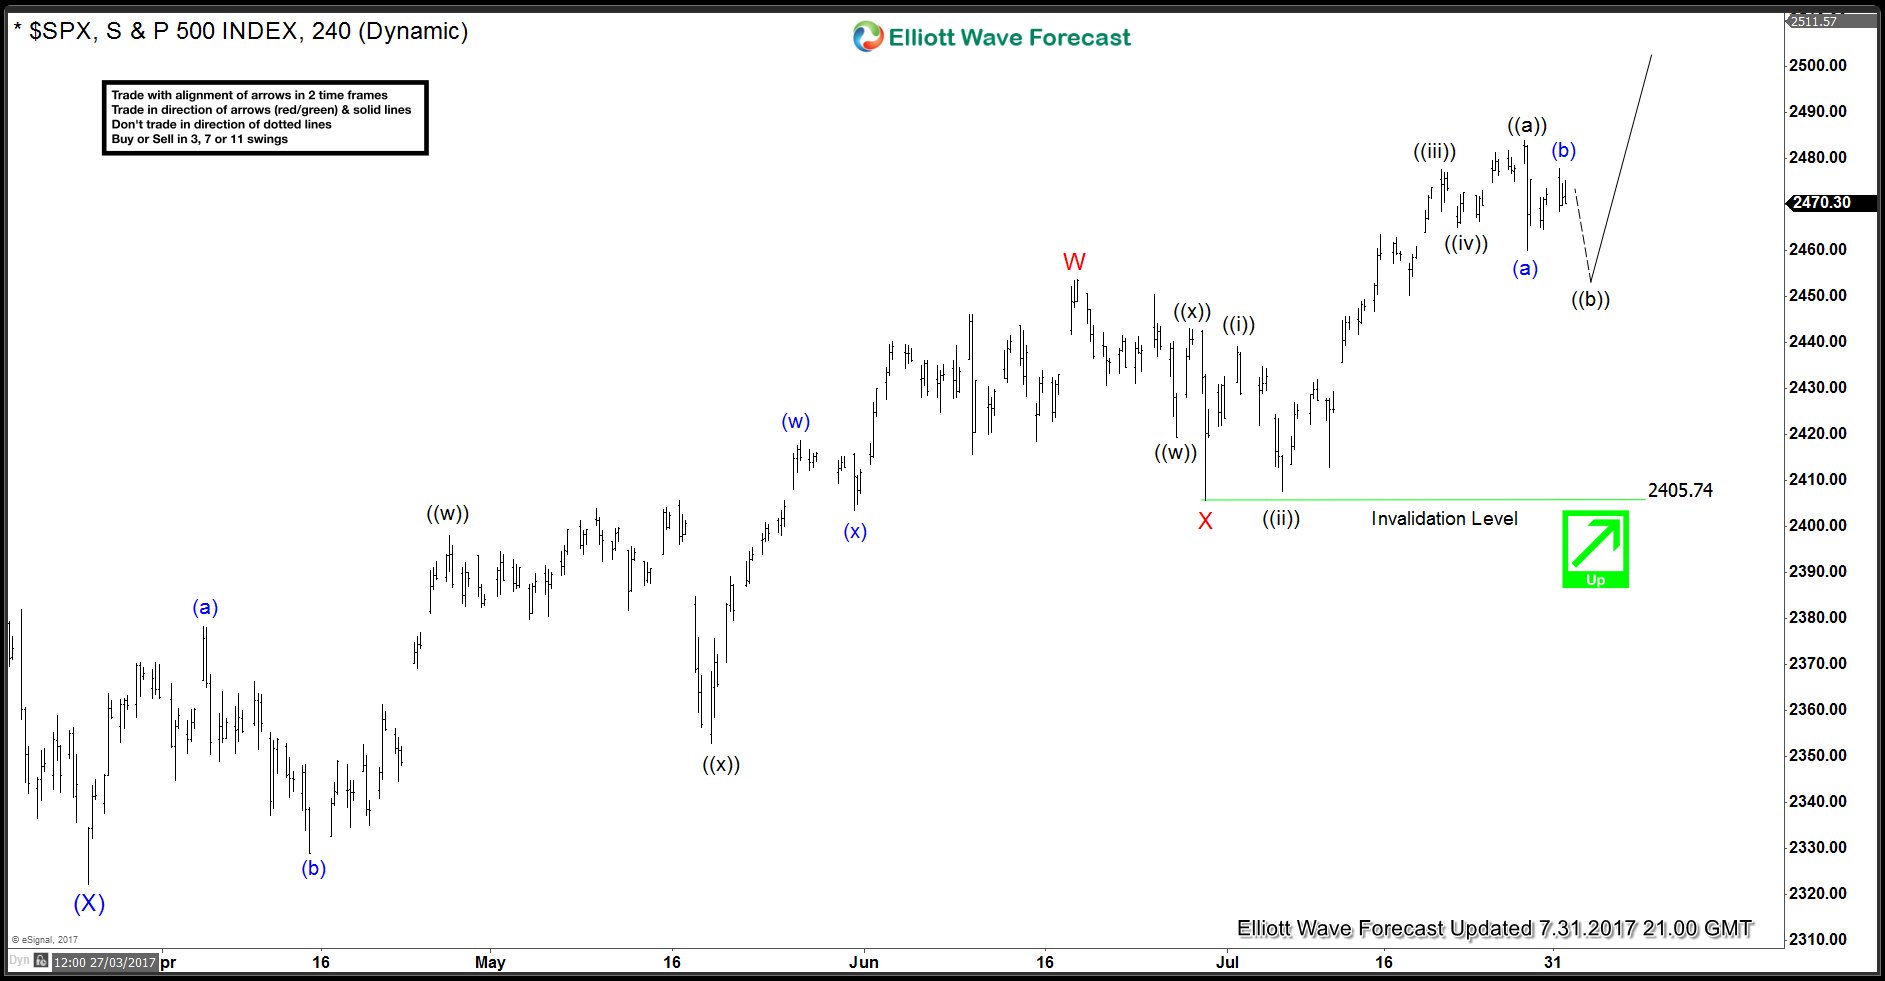
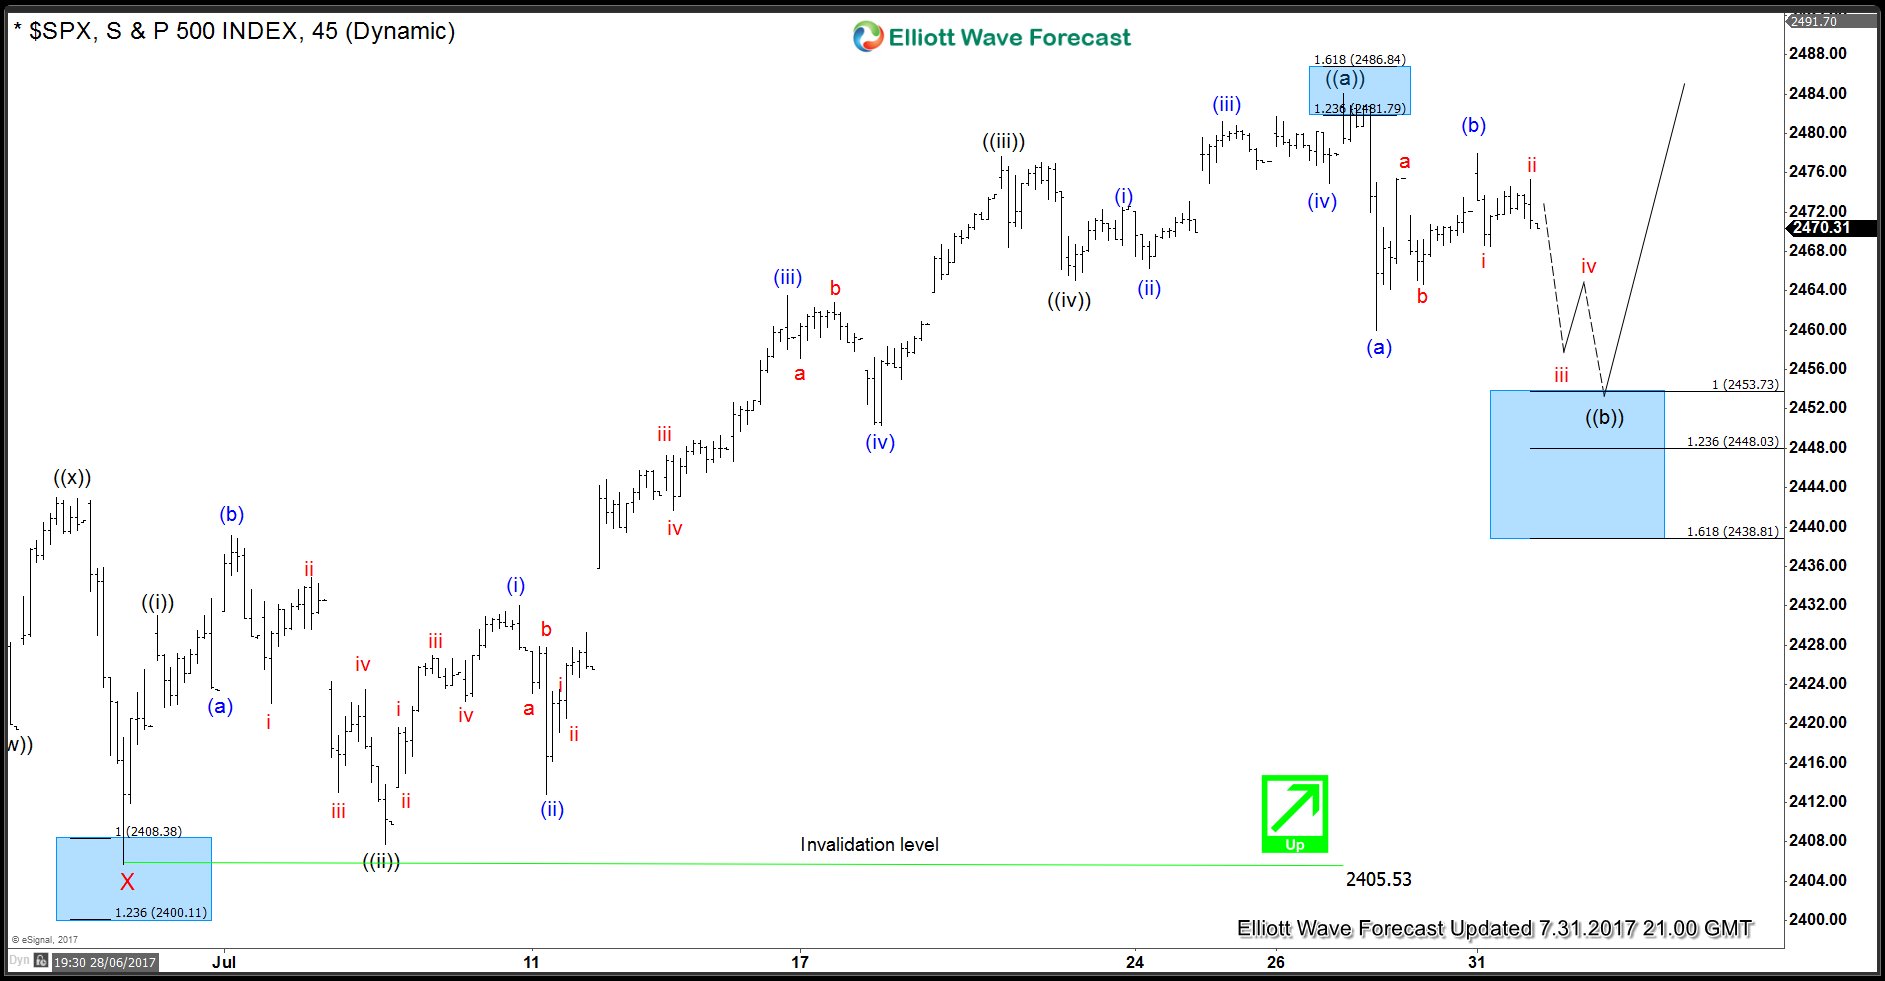
S&P 500 move up from 3/27 (2322) low is proposed to be unfolding as a double three Elliott wave structurewhen rally to 6/19 (2453) completed wave W and dip to 6/29 (2405.74) completed wave X. Up from there, Index rallied in 5 waves to 7/27 (2484) which completed wave ((a)) of Y and now the Index is showing 5 swings up from 3/27 low. 5 swings is an incomplete sequence and calls for more upside to complete 7 swings sequence. Index is currently in wave ((b)) correcting the cycle from 2405.74 low. This pull back is expected to unfold as a zig-zag Elliott wave pattern and while below 7/31 (2477), S&P 500 has scope to trade lower towards 2453.73 – 2438.81 area to complete wave ((b)). From this area, S&P 500 should turn higher to resume the rally in wave ((c)) of Y towards 2537 – 2568 area or bounce in three waves at least. In case the bounce from the above mentioned area fails to make a new high, then Index could turn lower and do a 7 swings pull back in wave ((b)) before starting wave ((c)) higher. We don’t like selling the Index and favor buying the dip towards 2453.73 – 2438.81 area looking for a target of 2537 area or a 3 waves bounce at least to get into a risk free position.
S&P 500 4 Hour Elliott Wave Chart
S&P 500 Potential buying area

