- SPX Monitoring purposes; Sold long SPX 6/7/19 at 2873.33= gain 4.41%; long 5/31/19 & 2752.06.
- Monitoring purposes Gold: Long VanEck Vectors Gold Miners ETF (NYSE:GDX) on 1/29/19 at 21.96.
- Long Term Trend SPX monitor purposes; Sold long SPX on 5/6/19 at 2932.61= gain 5.96%:
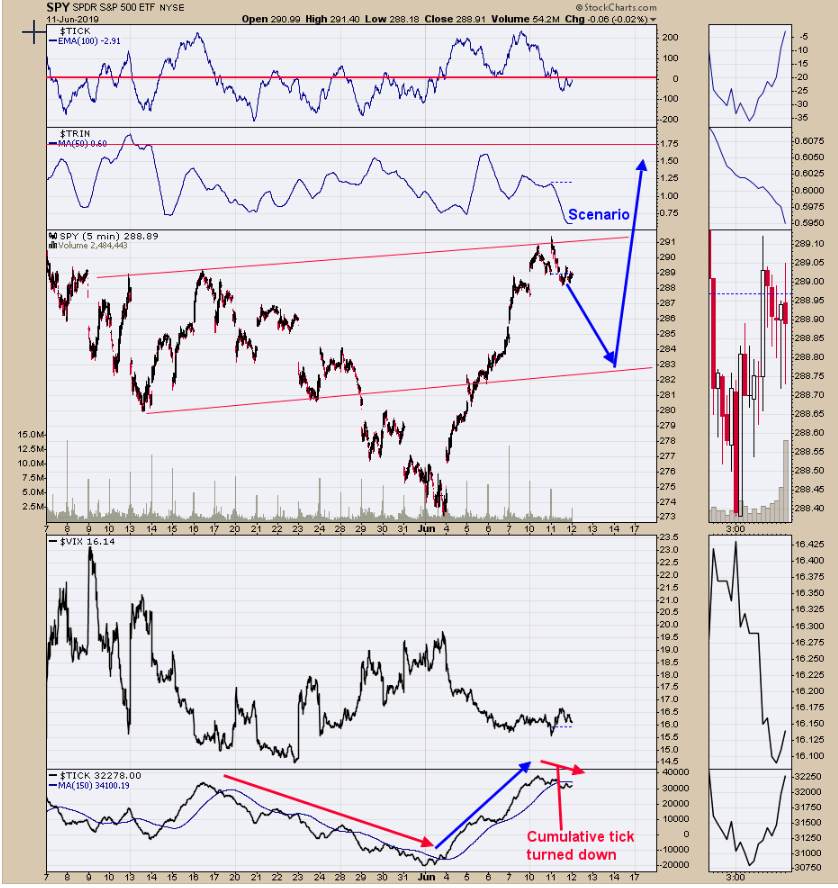
Yesterday we said, “This is the week before expiration week, which commonly has whipsaws and next week is option expiration week which normally has a bullish bias. Today marks five day up in a row which is bearish short term but bullish longer term. When market is up 5 days in a row the market is higher 8 days out 93% of the time. Since this week is the week before option expiration week and market up 5 days in a row the odds that a pull back will start is tomorrow. The pattern that could be forming here is a “Right Shoulder” of a Head and Shoulders bottom. The next low should see panic in the tick and trin to indicate support is near. The next area of support comes in near the 284 SPY range and a place to look for panic.” This scenario is playing out. The bottom window is the 150 moving average of the 5 minute Cumulative tick. It rises and falls with the market and over the last couple of days it has rolled over and a bearish short term sign. Watching for signs for the next bullish setup. Follow us on twitter. @OrdOracle Ask for free trial.
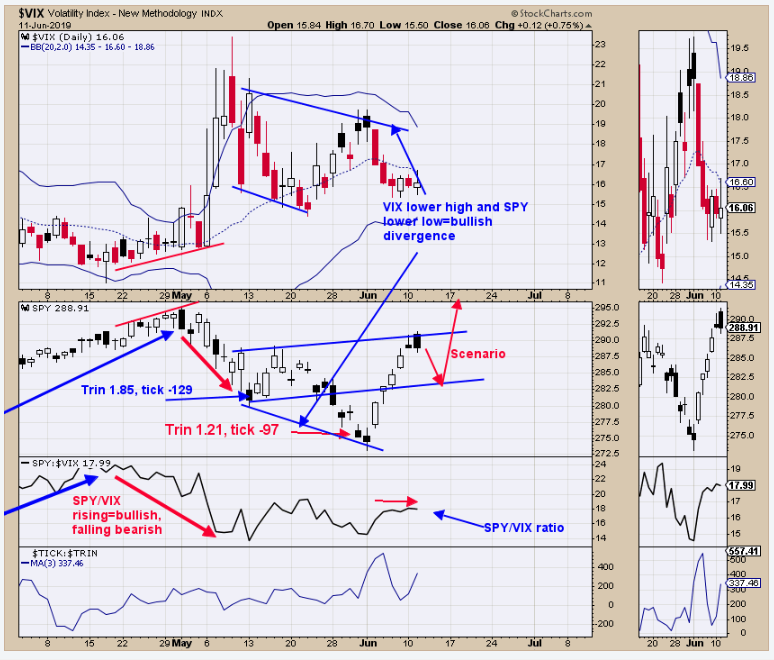
Second window up from the bottom is the SPY/VIX ratio. In down trending markets, this ratio declines and in an uptrend it rises. Since last Friday this ratio has trended sideways and not confirming Friday and Monday’s rise in the SPDR S&P 500 (NYSE:SPY). Also notice that SPY broke below its Mid May low near 280 hitting a low near 273 while the VIX did not close above it previous high of mid May which is a bullish divergence for the SPY. This condition suggests the SPY may hit a new high above the May high of 295 range once this potential consolidation is completed. Sold long SPX 6/7/19 at 2873.33= gain 4.41%; long 5/31/19 & 2752.06. Join us on twitter. @OrdOracle
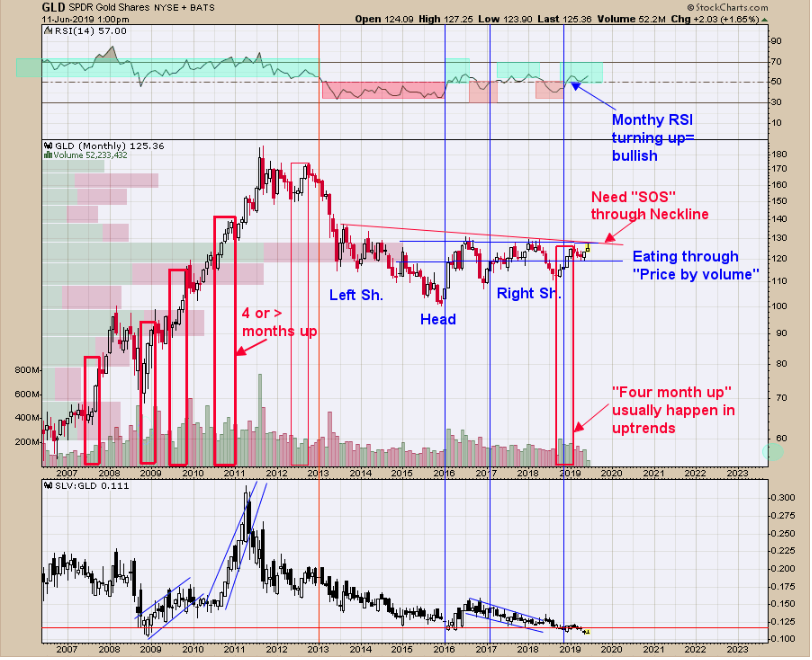
Monthly SPDR® Gold Shares (NYSE:GLD) is eating through the "Price by Volume" levels of 120 to 130 and once though should become strong support. Four or greater monthly rise in GLD happen in uptrend’s. The monthly GLD rose each month from October to January 2019. The Monthly RSI for GLD stands at 57 and readings above 50 show market is in an uptrend. Neckline of a potential Head and Shoulders bottom for GLD lies near 128 and will need "Sign of Strength" to confirm breakout of the Neckline and why gold may get stronger near term. Long GDX on 1/29/19 at 21.97. ord-oracle.com. New Book release "The Secret Science of Price and Volume" by Timothy Ord.


