- SPX Monitoring purposes; Long SPX on 5/21/18 at 2733.01.
- Monitoring purposes Gold: neutral
- Long Term Trend SPX monitor purposes: Long SPX 3/14/18 at 2749.48.
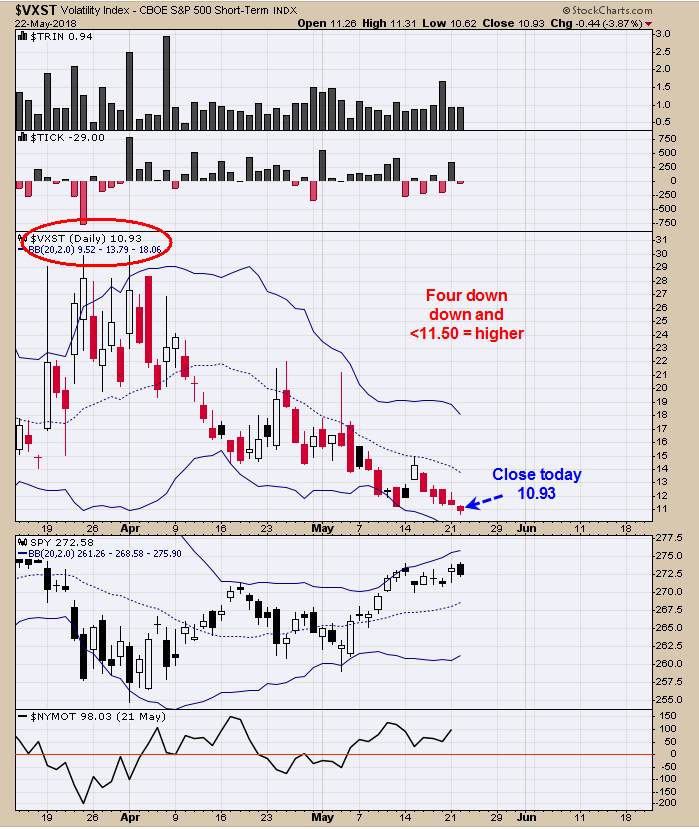
Here is an interesting statistics; short term CBOE Volatility Index (VXST) down four days or more in a row and below 11.50 the market is up the next day 78% of the time (courtesy @oddstats) . Today marks the fifth day down on VXST with a closing of 10.93. FOMC meeting minutes comes out at 2:00 Eastern tomorrow and market retracing into that announcement, seen a bullish outcome after the announcement. In conclusion, market may trade sideways this week and respond positive next week. Support comes in from 2700 to 2720 range on the SPX. Long SPX on 5/21/18 at 2733.01. Follow us are twitter. @OrdOracle.
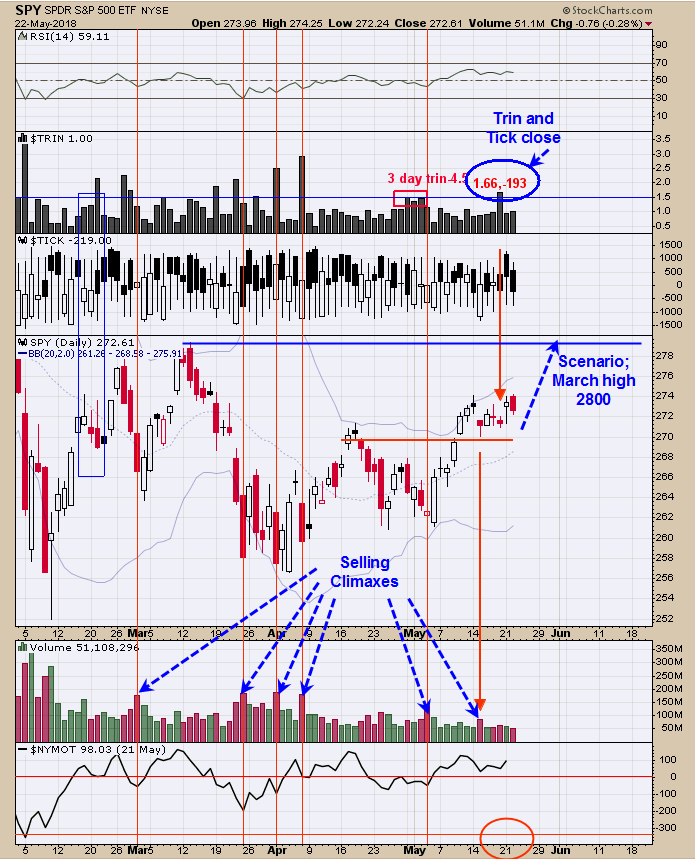
Yesterday’s commentary still appears on target and little needs changed. “The Trin closed Friday at 1.66 and the Ticks at -193 and a bullish combination; A short term low can be expected the same day as the bullish reading to as late as two days later. With today’s rally, the low could have formed Friday. There is a chance that the market could test last Tuesday’s low (Selling Climax low) before heading higher and that chance is now lower. There could be back and filling but market is should start to head higher in the coming days to the next higher high which is the March high near 2800.” SPDR S&P 500 (NYSE:SPY) appears to be building a trading range (consolidation pattern) to build strength for the next rally.
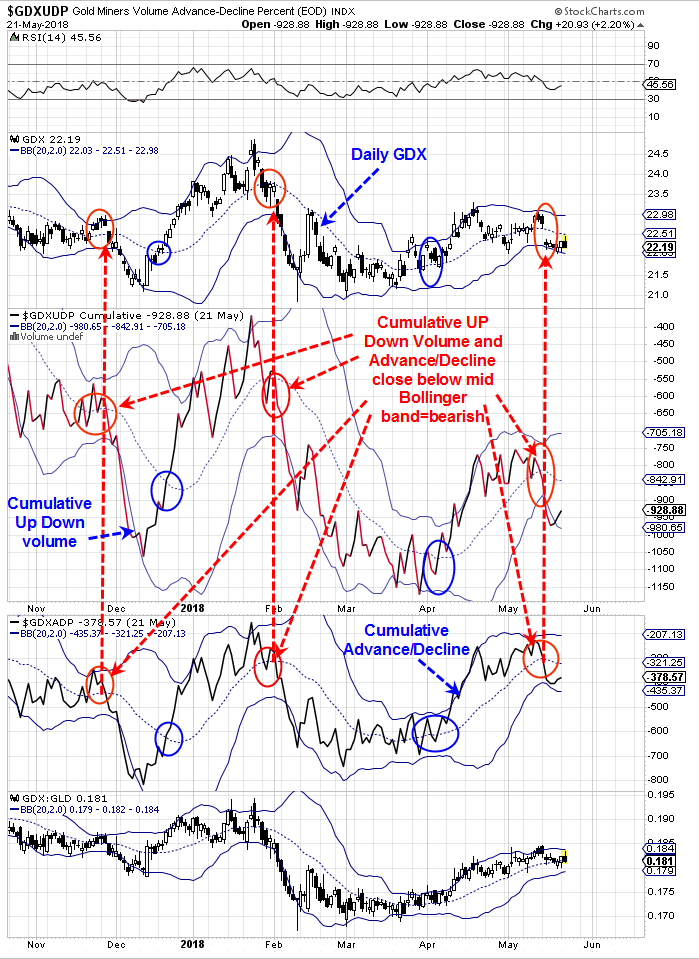
Yesterday we presented the weekly Gold Miners index, which showed bullish intermediate term indicators and showed that when the short term pictures turns back to bullish it could lead to an extended move to the upside. Today we are back looking at the short term picture. Above is the cumulative Up Down Volume and cumulative Advance/Decline. When these two indicators fall below their mid Bollinger® bands, it triggers a short term sell signal (which was triggered a few days ago). Until the cumulative Up Down volume and Advance/Decline turn back above their mid Bollinger bands the sell signal will remain in force. At some point in the future, it will flip to a buy signal and that signal could lead to a large move. New Book release "The Secret Science of Price and Volume" by Timothy Ord


