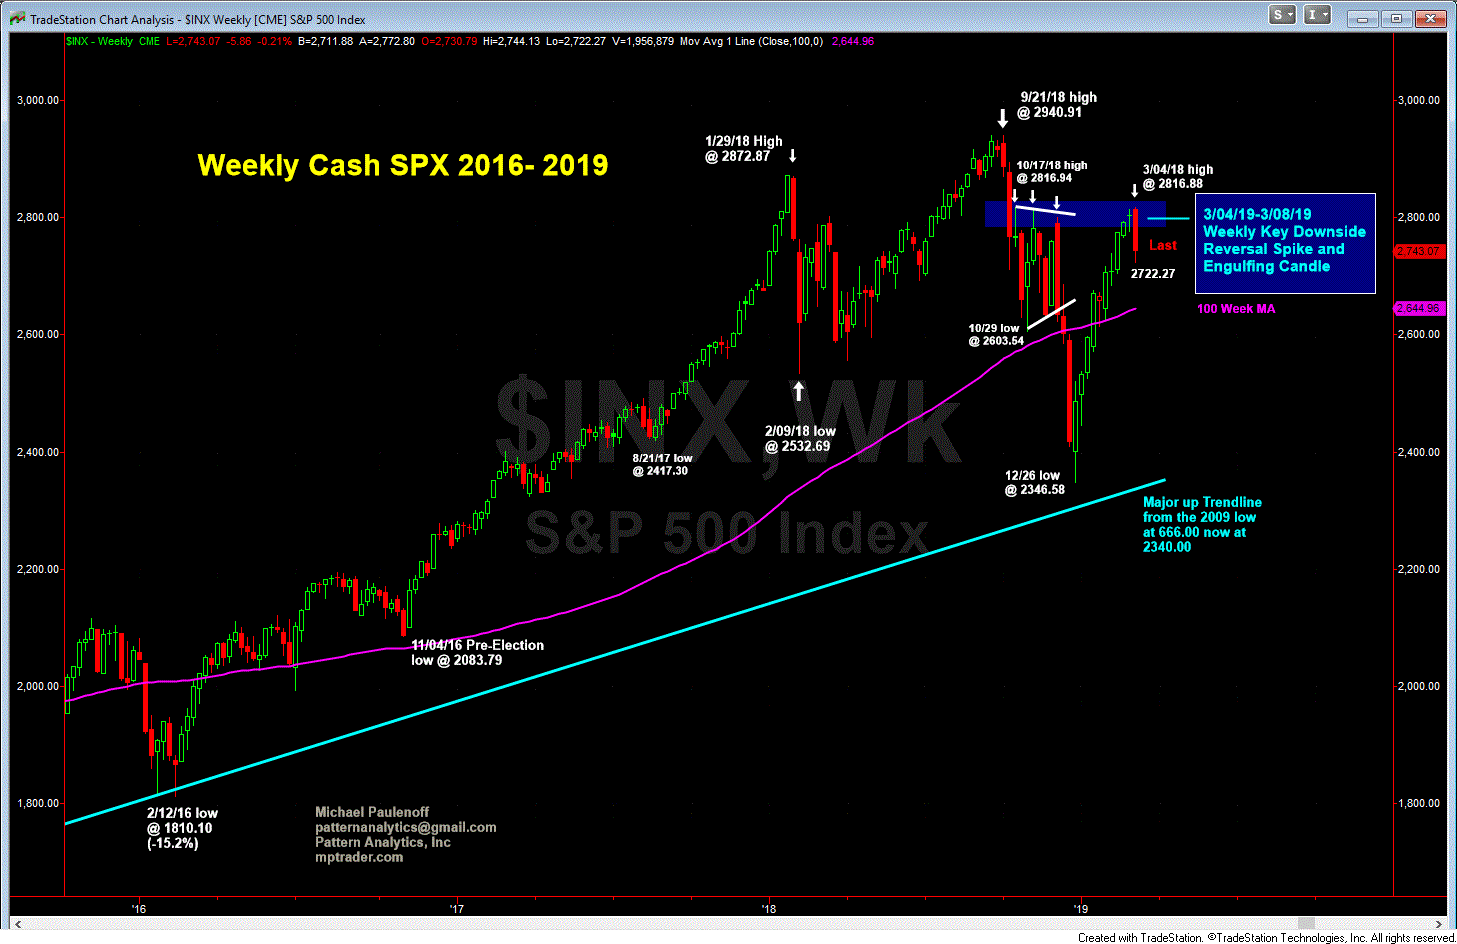
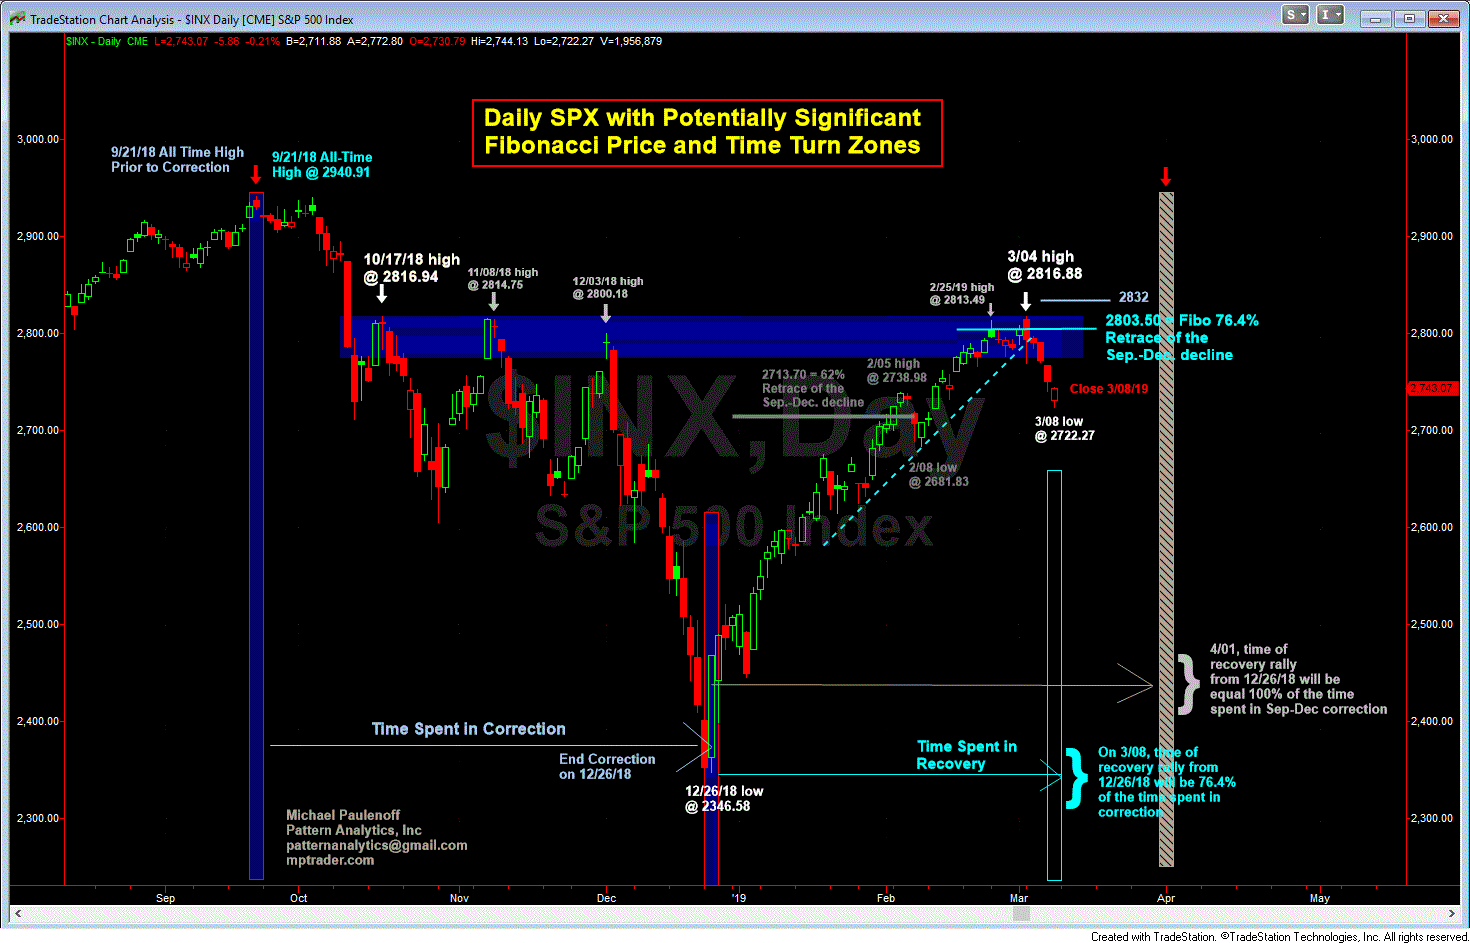
In last weekend's article entitled, “SPX: New All-Time Highs or Bust?” we discussed an expected powerful resistance level in the S&P 500.
Price strength from the December low was nearing an important 76.4% Fibonacci level in its recovery -- the level of 2803.50 (+/- 1% = 2775 to 2832) -- for the second consecutive week. Meanwhile, the time spent in the post-December rally was also approaching an important Fib level -- equaling 76.4% of the time spent in the Sep-Dec correction.
We considered this intersection of Fibonacci levels in recovery price and time a resistance warning zone from where either a meaningful reversal or upside acceleration would emerge.
Sure enough, the markets rallied on Sunday evening into Monday morning to a new SPX recovery high at 2816.88, but stalled and turned lower from there. The rally was triggered by Sunday afternoon headlines (WSJ) that the U.S. and China were “closing in on a Trade Deal,” and that President Trump was on the verge of lifting all tariffs on Chinese imports.
That 2816.88 level reached during the first hour of trading last Monday turned out to be the high for the week. Thereafter, the SPX declined to Friday’s low at 2722.27, or -94.61 points and -3.4%, before Friday’s late-session bounce closed the index at 2743.07.
From a charting perspective, the action from March 4 through March 8 constituted a key downside reversal week (aka a bearish weekly engulfing candle), which is considered a reversal sign of near-term trend direction. To put a fine point on it, within my Fibonacci 76.4% price and time warning window of 2803.50 (+/- 1%) into March 8, the SPX declined nearly 3.5%.
What's Ahead?
As we head into a new week, the question is whether the 76.4% Fibonacci price and time intersection represented a major downside reversal or a brief pause within an incomplete advance from the December lows.
Last week’s persistent decline occurred despite presumably positive news about a resolution to the U.S.-China trade dispute and additional central bank stimulus from the ECB (a return to QE to support the ailing EU economy). These are two headline-drivers that continually and relentlessly propelled equity markets higher since Fed Chair Powell’s January 4th back-pedal on rate hikes.
To me, the 76.4% Fibonacci price resistance zone is a warning sign that 2803.50 to 2832.00 represents a ceiling on “official” Fed and China tariff psycho-babble designed to buoy markets in the absence of concrete changes (i.e., the need for an actual rate cut rather more Fed jawboning about “the pause,” and an announcement that the U.S. is lifting tariffs on a particular date, rather than some vague reference to a Trump-Xi signing ceremony at Mar-a-Lago).
As far as I am concerned, traders and investors have been warned that for markets to move higher, new bullish catalysts will be required.
On the subject of market catalysts, already today (Sunday Mar 10) we see WSJ, Bloomberg, and MarketWatch stories about the China talks, the Fed, and tonight’s 60 Minutes segment with Fed Chairs Bernanke, Yellen, and Powell. Let’s pay particular attention to whether and how the markets respond to these articles compared with last Sunday evening's strength.
During the upcoming week, I will be watching 2803.50 to 2832.00 (Fibonacci 76.4% price recovery zone of the entire Sep-Dec decline), and April 1, which represents the date when the time spent in recovery is equal to 100% of the time spent in correction.
As long as 2803.50 to 2832.00 remains viable resistance on any forthcoming strength, then a resumption of weakness and the threat of more price weakness will project to 2620-2640, and will extend price vulnerability into the April 1st timeframe.
Conversely, if SPX manages to climb above the Mar 4 high at 2816.18, and follows through above 2832.00, then the strength will project a total retracement of the Sep-Dec decline and a test of the all-time high into the first week of April.


