- SPX Monitoring purposes; Sold 8/21/1/ at 2862.96= gain 1.05%; Long SPX 8/10/18 at 2833.28.
- Monitoring purposes Gold: Long GDX at 18.72 on 8/17/18
- Long-Term Trend SPX monitor purposes; Sold long term SPX 7/16/18 at 2798.43= gain 2.95%; Long 6/29/18 at 2718.37.
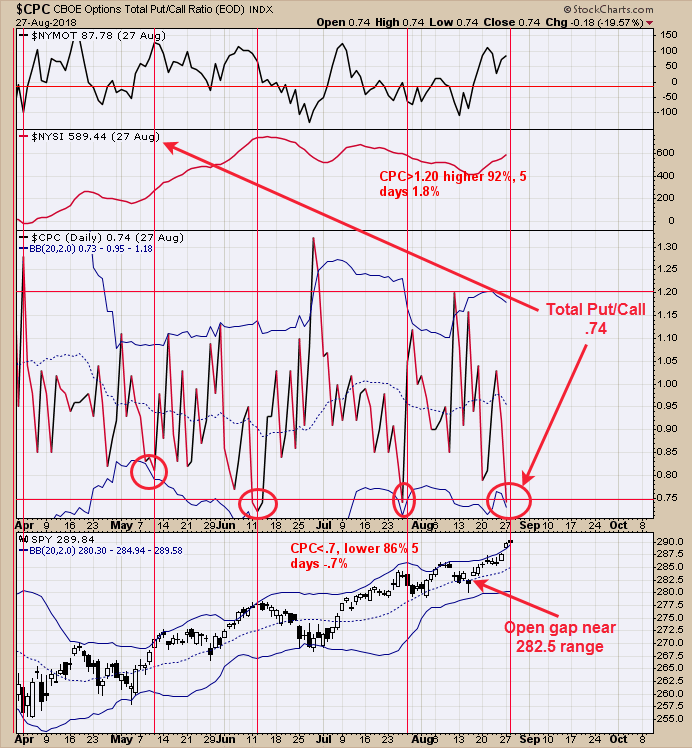
Yesterday the “Total Put/Call ratio” (CPC) closed at .74. Bearish signs are triggered when the CPC hits its lower Bollinger® band or closes below .75 (both happen here), the market is usually near a short term high. The bottom window is the SPY (NYSE:SPY), which hit its upper Bollinger Band and a resistance area. Seasonality wise, September is the weakest month of the year and a pull back in that timeframe would be normal. There is an open gap (most open gaps get filled at some point) near the 282.5 SPY range and a downside target. Don’t see a save trade yet and will remain on sidelines. Follow us on twitter. @OrdOracle.
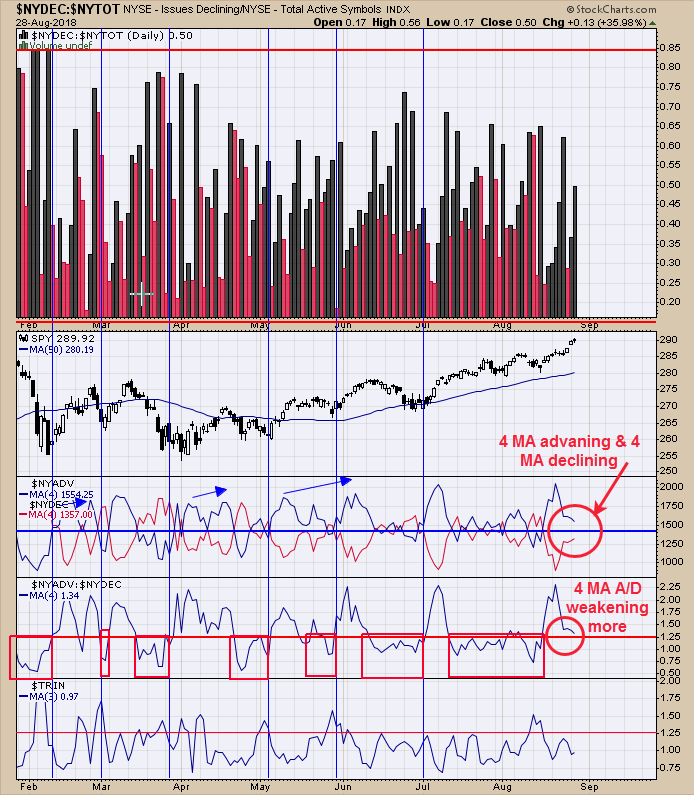
The second window up from the bottom is the NYSE advance/NYSE declining with a 4 period moving average. Reading above 1.25 are bullish and below bearish. This indicator closed yesterday at 1.37 and weakened today to 1.34. Next window up is the NYSE advance with 4 period moving average (blue line) and NYSE declining with 4 period moving average (red line). When the blue line is above the red line the market is in a bullish position (still holding bullish), however the blue and red lines are narrowing showing upside strength is decreasing. A crossing of the lines where red is on top would be a bearish sign. Up trend is weakening. Volume most likely will be weakening going into the three day weekend as traders take off early for the Holiday and upside will most likely be limited. We sold our long position for a 1.05% gain and will remain flat for now. Follow us on twitter. @OrdOracle.
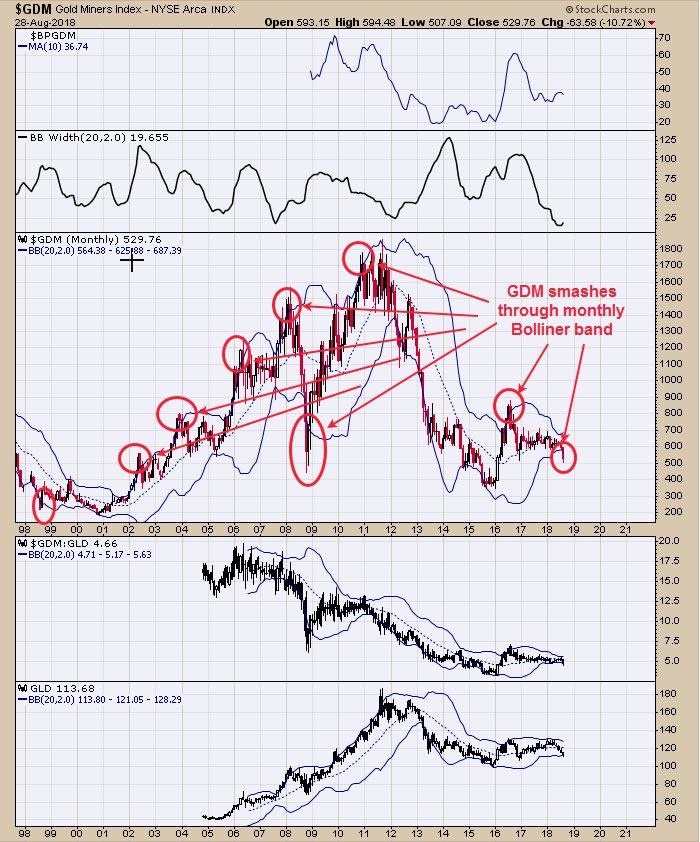
GDM smashes through monthly Bollinger band have lead to large reversals. The chart above is the monthly Gold Miners index going back to 1998. We have pointed out with red circles the times when the monthly GDM closed above its upper and lower Bollinger bands. The more GDM closed above or below its Bollinger band the sharper the reversal. This month doesn’t end tell Friday, but it closes near current levels will suggest a large reversal is in the making. There are other longer term studies suggesting GDX could be higher by 40% in November (3 months out). Long GDX at 18.72 on 8/17/18. New Book release "The Secret Science of Price and Volume" by Timothy Ord.


