- SPX Monitoring purposes; Neutral.
- Monitoring purposes Gold: Covered short 8/11/17 at 23.15; loss 4.28; Short GDX @ 22.20 on 8/7/17
- Long-Term Trend monitor purposes: Neutral.
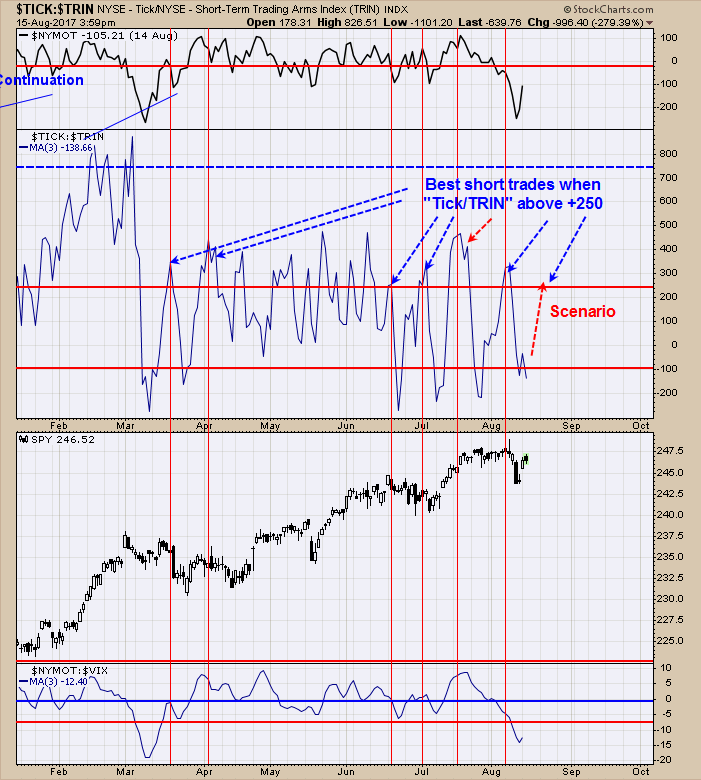
On yesterday’s commentary we said, “The Equity Put/Call ratio closed at .94 Friday; reading .75 and high have predicted a bounce in the market, 88% of the time, within the next 3 to 5 days with an average gain of 1.3. The combination tick and trin readings did not produce a bullish signal last week but the Put/Call ratios did. There was an open gap from last Wednesday’s close to Thursday’s open and SPDR S&P 500 (NYSE:SPY) is testing that area now on lighter volume suggesting this gap has resistance.” SPY is still testing the gap and still on light volume. The Tick/TRIN ratio helps to find areas where a short trade is feasible and that level comes in at an area above +250 and as the chart was created today, it far below that level. This is option expiration week which normally has a bullish bias and market may hold up this week. The total decline is not expected to exceed 5% but 3% is reachable.
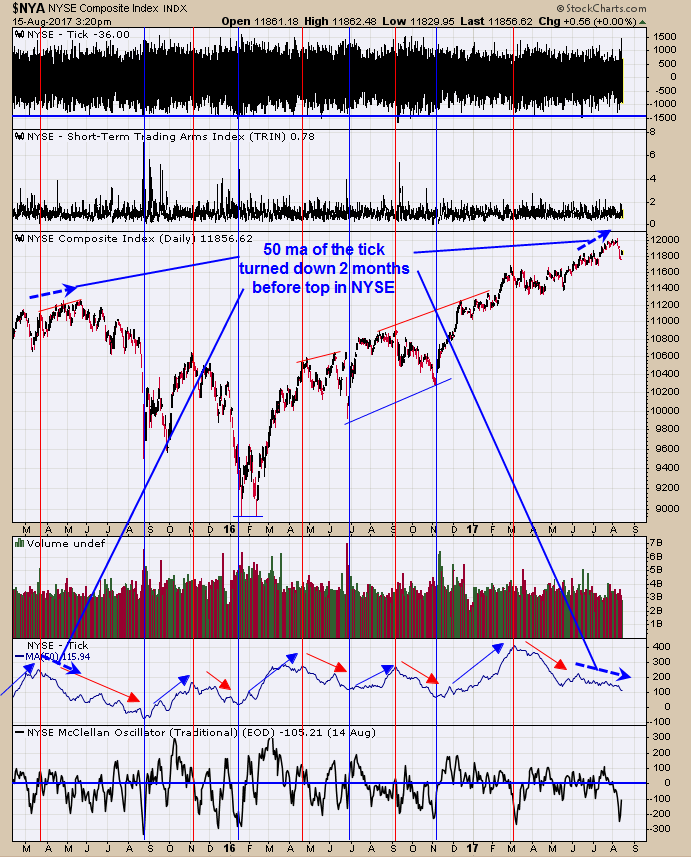
The second window up from the bottom is the 50 period moving average of the tick. In general the 50 MA of the tick rises and falls with the NYSE and when it doesn’t (like now) there is usually a change is trend coming. The top back in 2015 showed the tick turned down about two months before the top in late May. This year the 50 MA of the tick turned down in early June and the top came in early August. The 50 MA of the tick is more evidence that market has started a consolidation phase and goes along with yesterday’s report about the McClellan Oscillator reaching below -200, which also suggests consolidation. The trending market that began last November most likely has ended and a trading environment has started that could last into October.
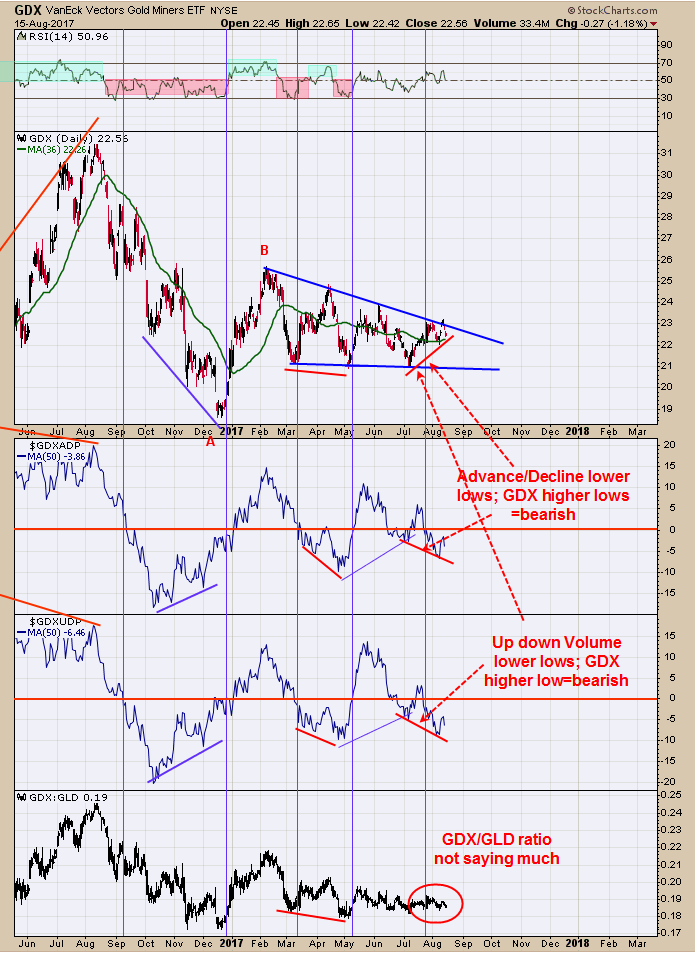
Yesterday we said, “Second window up from the bottom is the 50 period moving average of the Up down Volume percent which is below “0” and has made lower lows as GDX made higher lows and a bearish sign for GDX. Next window up is the 50 period moving average of the Advance/Decline percent which is also below “0” and also has made lower lows as GDX made higher lows and a bearish sign. The pattern forming on GDX appears to a “Triangle” pattern which normally breaks in the direction that preceded it and gives a prediction for GDX a bullish resolution. The Up down Volume % and Advance/Decline % have gave good signals in the past and but recently there have been two failed signals. The failed signals can warn that there is a character change in the market (“character change” happens as a new trend is about to appear). Right now both the Up down volume and Advance/Decline indicators is showing bearish signs and if the bearish signals fail to materialize a bullish resolution could be forming and the next bullish phase in GDX is beginning.” If there is going to be a failure it should show it hand in the next several days.


