- SPX Monitoring purposes; Long SPX on 10/22/18 at 2755.88.
- Monitoring purposes Gold: sold 11/27/18 at 18.88=gain .075%; Long VanEck Vectors Gold Miners (NYSE:GDX) at 18.72 on 8/17/18
- Long-term Trend SPX monitor purposes; Long SPX on 10-19-18 at 2767.78
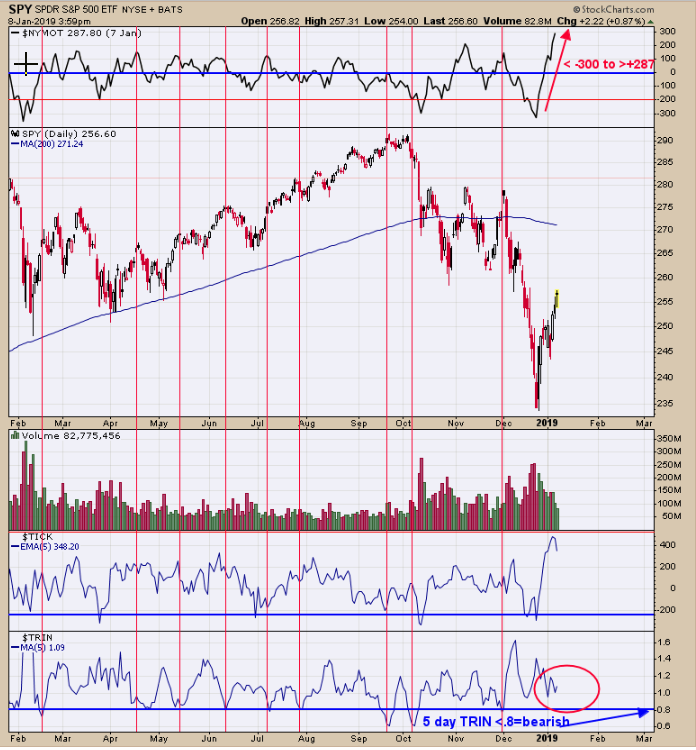
The bottom window is the five day average of the TRIN. Short term highs have been found when the “5 Day TRIN” reaches .80 and lower (identified with red vertical lines). The current reading is 1.09 and in neutral territory. The top window is the NYSE McClellan Oscillator. According to the McClellan rules when the McClellan Oscillator travels from -300 to +200 within two weeks (Current setup was -319 to +287 and still rising) suggests an initiation of an up-move. There can be pull backs when these readings are met but suggest an uptrend is starting. What is interesting here is that the Advance/Decline was over 3/1 to the upside which in turn will push the McClellan Oscillator even higher today. Market could move higher short term. Follow us on twitter. @OrdOracle.
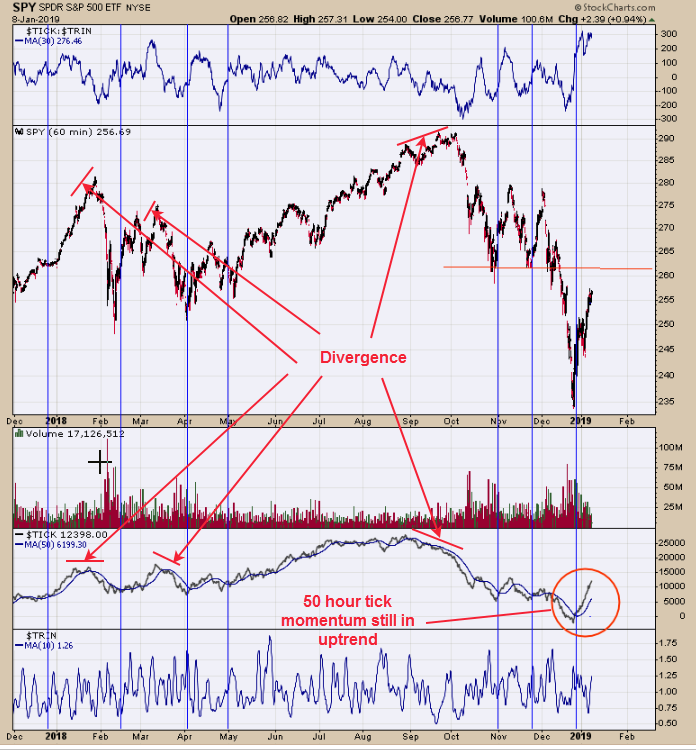
FOMC meeting announcement is tomorrow and we where looking for signs for short term exhaustion today….. we really didn’t find any. The second window up from the bottom is the 50 hourly moving average of the tick. 50 hour tick in general fall and rise with the SPY (NYSE:SPY). Today the Tick closed at +638 and another strong tick close. The last seven days saw the tick each day close above +390 and suggests strong short term momentum. It common near short term highs on the SPY that the SPY will continue higher and the Ticks will start making lower highs suggesting upside momentum is waning and so far that has not happen. Market can still push higher short term. Follow us on twitter. @OrdOracle.
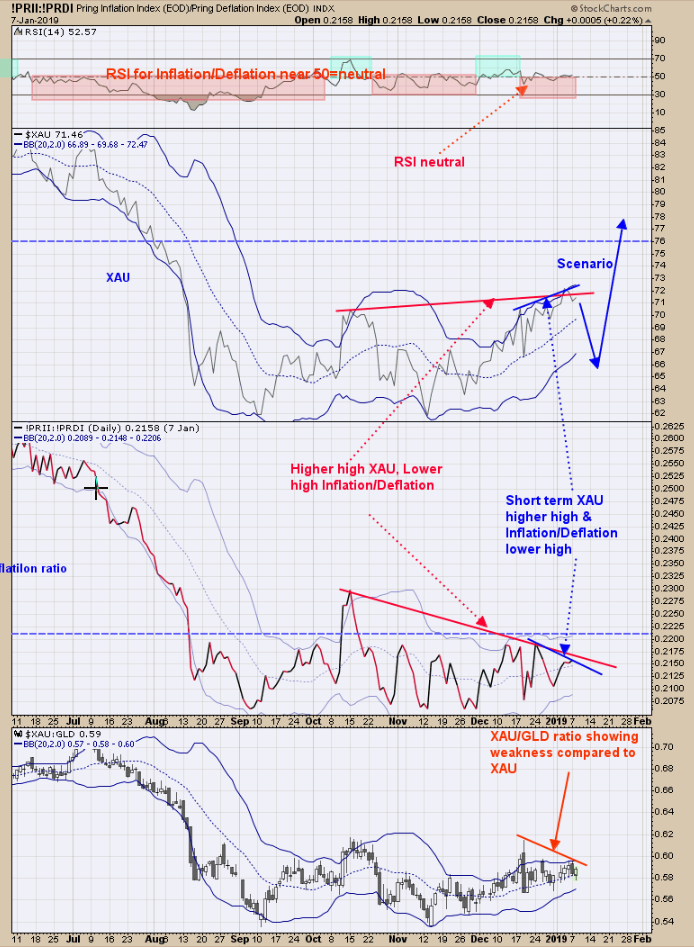
Divergences are present and not a lot has changed from yesterday. The bottom window is the XAU/GLD ratio, which as made lower highs as XAU made higher highs. For a bullish sign, XAU/GLD should be outperforming the XAU and that is not happening here. The inflation/Deflation ratio normally marches in step to XAU and when there is a divergence between the two, the ratio usually has the correct move. The daily VanEck Vectors Gold Miners exceeded its October high and the Inflation/Deflation ratio fell short to its October high, showing the ratio is much weaker than XAU and a bearish sign for XAU. The short term picture for Inflation/Deflation ratio is also showing weakness compared to XAU, as XAU makes short term higher highs and Inflation/Deflation makes lower highs. A possible pull back may materialize short term for the XAU (GDX). Ideal time for a gold and gold stock bottom is around January 22, but can change as time gets closer. Not sure if the pull back will test the September low but it could. This potential pull back could lead to a longer bullish setup. We will show why on tomorrows report. It has to do with the weekly Inflation/Deflation ratio. We will wait for the next bullish setup. ord-oracle.com. New Book release "The Secret Science of Price and Volume" by Timothy Ord.


