- SPX Monitoring purposes; Neutral
- Monitoring purposes Gold: Short GDX on 11/13/17 at 22.56
- Long-Term Trend monitor purposes: Neutral.
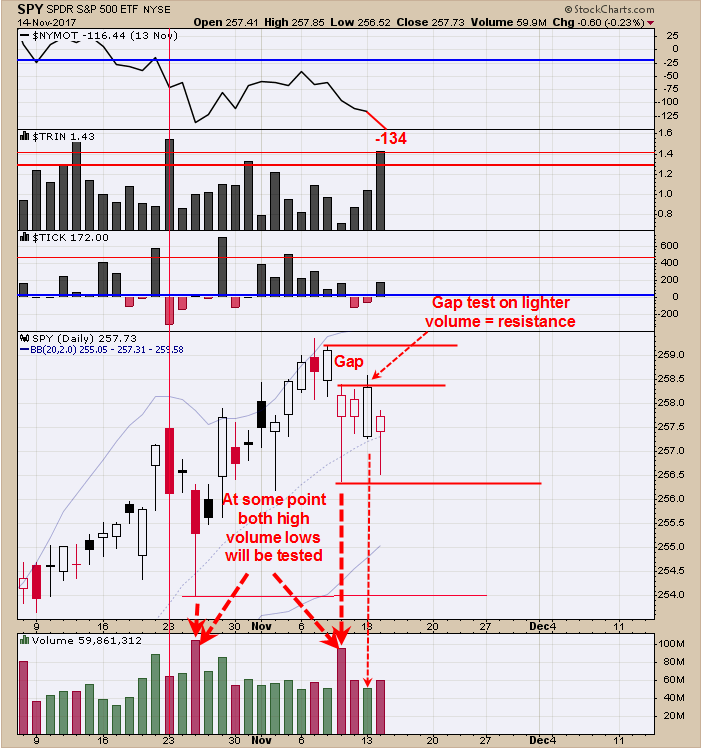
Yesterday the SPY (NYSE:SPY) ran into the gap level at the 259 to 258.5 level that develop between last Wednesday’s close to Thursday’s open and on lighter volume showing the gap has resistance. Not sure what will happen tomorrow but so far we have not seen the combination both panic in the Tick and Trin suggests a bottom has not been found yet Statistics show that November option expiration are up 70% of the time but it appears this November could be up also but not by much. Ideally we would like to see Last Thursday’s low tested on lighter volume along with TRIN and Tick extremes for a bullish setup. We are standing aside for now.
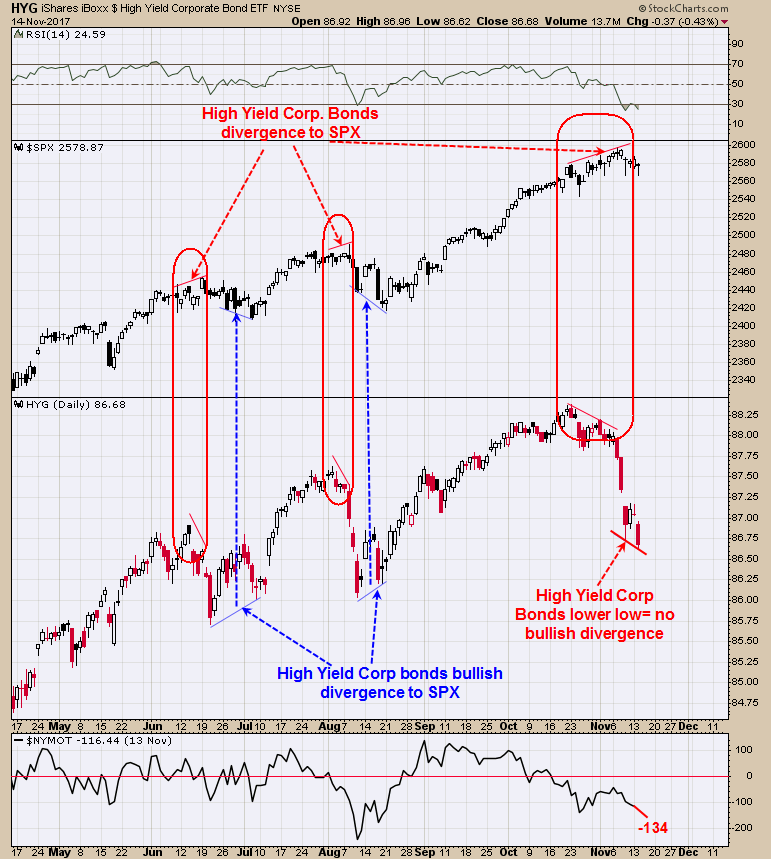
The middle window is the High Yield corporate Bonds (NYSE:HYG). Some times at highs and lows in the SPX a divergence will show up between the SPX and HYG. The June and August highs in the SPX showed a divergence where the SPX made higher highs and the HYG made lower highs and a bearish divergence for the SPX. This divergence also showed up and the current high. At the lows in early July and Mid August on the SPX the HYG made higher lows and the SPY made lower low producing a bullish divergence for the SPX. So far the HYG is still making lower lows suggesting the bottom in SPX still lies lower. The bottom window is the McClellan Oscillator which is below “0” since late October and usually uptrend don’t begin when the McClellan Oscillator is far below “0” closing at -134, new short term low. Also we have not seen panic in the TRIN and TICKS which normally appear at a washed out low.
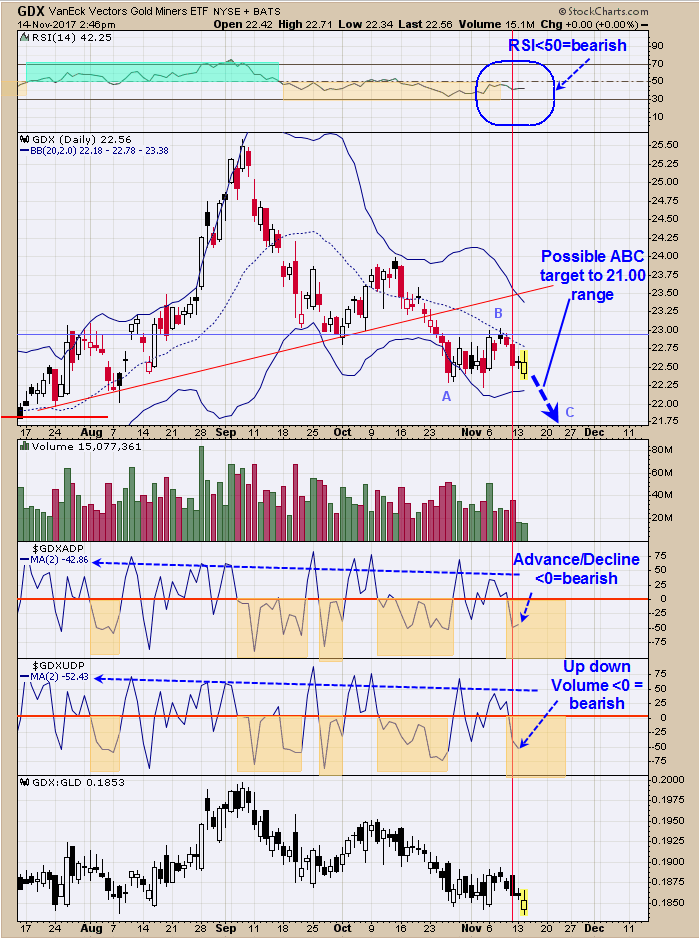
The top window is the RSI for GDX and it has been < 50 since mid September and remains in bearish territory. Second window up form the bottom is the Up down Volume indicator with a two period moving average. Readings below “0” are bearish and the last reading came in at -42.86. Next window up is the Advance/Decline with a two period moving average and readings below “0” are bearish and the last reading came in at -52.43. The internal are weak for the moment suggests the pull back in GDX should continue. Once the internals start to strengthen again we will cover our short what ever the price may be. The pattern forming could be an ABC down and “B” wave may have finished at last weeks high. The “B” wave a lot of the time market the half way point of the move down which in this case would give a target near 21.00 range. Short GDX on 11/13/17 at 22.56.


