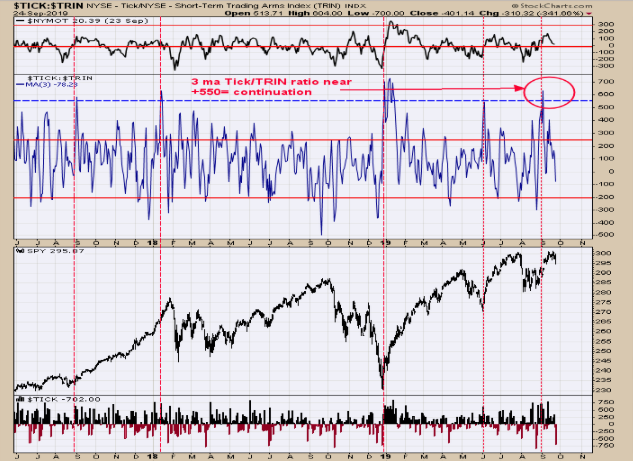
Yesterday, we said, “The middle window on the chart above is the 3 period moving average of the Tick/Trin ratio. It is implied the market will continue higher when the Tick/Trin ratio reaches above +550. This number was reached back in early September. The evidence suggests the SPX rally can continue.” Today’s tick and trin closes recorded panic readings suggesting a low is nearby. Though market has gone through a consolidation, the evidence suggests the rally higher is not done. Follow us on twitter. @OrdOracle.

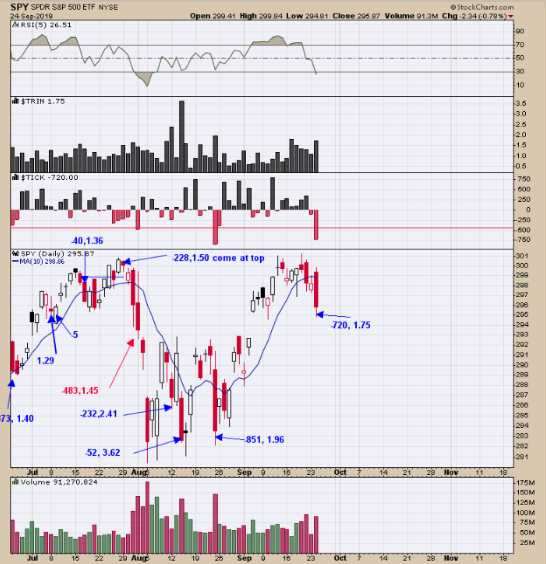
We got panic as the tick and trin readings today suggests a bottom is near buy. According to our rules we develop years ago, when panic readings are recorded in the tick and trin, a bottom is expected the day of the readings to as late as two days later. Today the Trin closed at 1.75 and the Ticks at -720 which are in panic levels suggesting a low formed today to as late as Thursday. With the Tick/Trin ratio on page one suggesting a trending market is underway and break above the July high is possible. Long SPX on 9/18/19 at 3006.73.

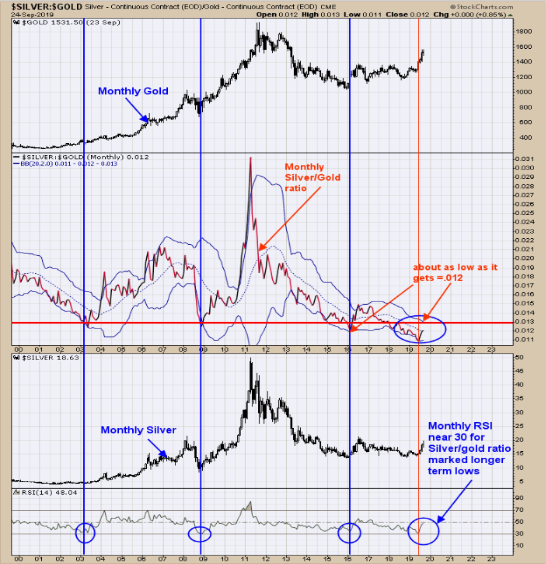
Above is monthly Silver:Gold ratio going back to 2000 (center window). The bottom window is the monthly RSI of this ratio. Longer term lows in this ratio have been found when the monthly RSI of this ratio reaches near 30. We have marked with blue (and one red for the current timeframe) vertical lines where the RSI was near 30. The RSI 30 range has marked lows in this ratio, in some cases that last years. The current RSI 30 range came in June 2019 and has risen since. The rising of the ratio shows that Silver is outperforming gold and that condition usually happens in precious metal bull markets. Long GDX (NYSE:GDX) on 1/29/19 at 21.97. New Book release "The Secret Science of Price and Volume" by Timothy Ord.
