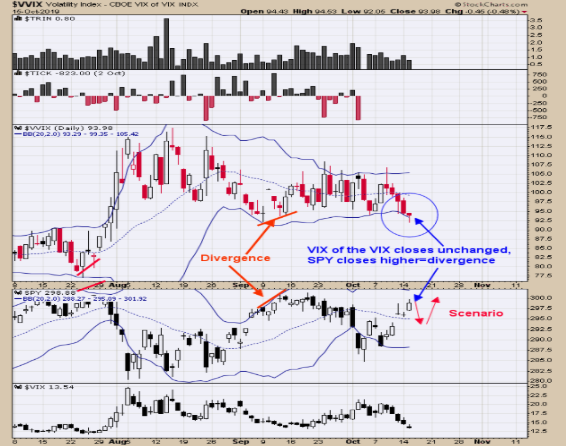
Above is the chart of the CBOE Volatility Index of the VIX (CBOE Vix Volatility). The VVIX trades opposite of the SPY. Today the SPY was near up 1% of the VVIX was nearly unchanged and a short term divergence. SPDR S&P 500 (NYSE:SPY) gapped up Friday and with this divergence may mean Friday’s gap may be tested before heading higher. Intermediate term trend appears up but a short term pull back is possible. Long Term Trend SPX monitor purposes; Long SPX on 10/14/19 at 2966.15. Follow us on twitter. @OrdOracle.

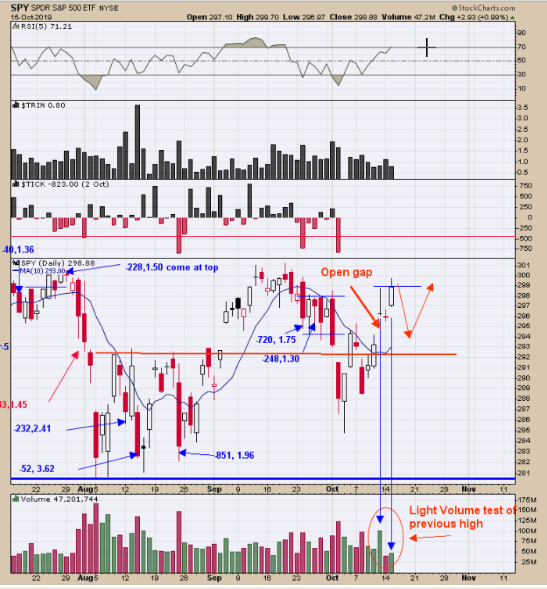
Today’s rally tested last Friday’s high on less than half the volume. A test of a previous high on light volume is a bearish sign and suggests the previous high has resistance. To go a step further; a test of a previous high on 50% lighter volume compared to a test 10% lighter volume, the 50% lighter volume test shows much more weakness as volume is energy and less energy means less force to push through the previous high. SPY (NYSE:SPY) appears to be stalling here for a test of Friday’s gap.

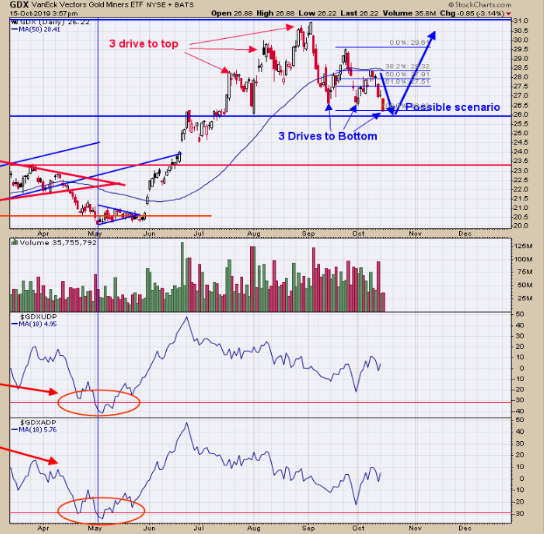
In the October 10 report, we said, “ Going into the early September high a pattern called “Three Drive to Top” formed. This pattern can be identified when the second decline off the second top retraces at least 61.8%, which this one did.
