🥇 First rule of investing? Know when to save! Up to 55% off InvestingPro before BLACK FRIDAYCLAIM SALE

SPX, Gold And GDX Technicals: 09_05_18

Published 09/05/2018, 10:54 AM
Updated 07/09/2023, 06:31 AM
XAU/USD
-
US500
-
DJI
-
GC
-
GDX
-
VIX
-
TIC.N
-
STI.N
-
  • SPX Monitoring purposes; Long SPX on 8/31/18 at 2901.52.
  • Monitoring purposes Gold: Long GDX at 18.72 on 8/17/18
  • Long-Term Trend SPX monitor purposes; Sold long term SPX 7/16/18 at 2798.43= gain 2.95%; Long 6/29/18 at 2718.37.
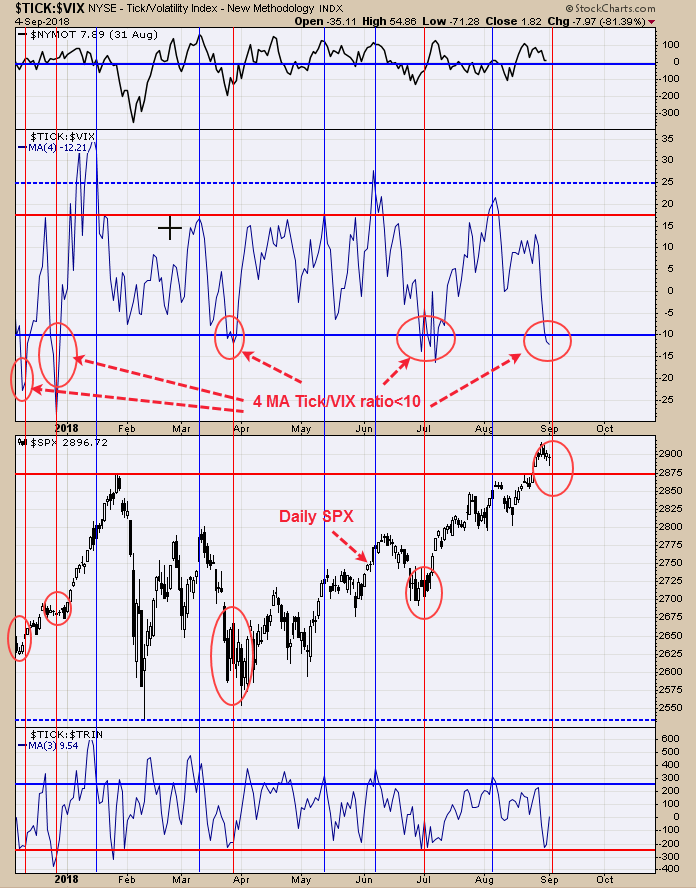
  • Tick/Vix Raito

    We research a lot of different ratios, some provide good information and others, not so much. The middle window above is the four period moving average of the Tick/Vix raito. When this ratio is above +18 the market has been near a short term high and below -10 the market has been near a short term low. Today’s close came at -12.21. Also the Dow Jones has been up four days in a row going into last Wednesday, it will be higher at least once within the next five days 82% of the time, today marks day three so by Thursday it should be higher, we will see. Follow us on twitter. @OrdOracle.

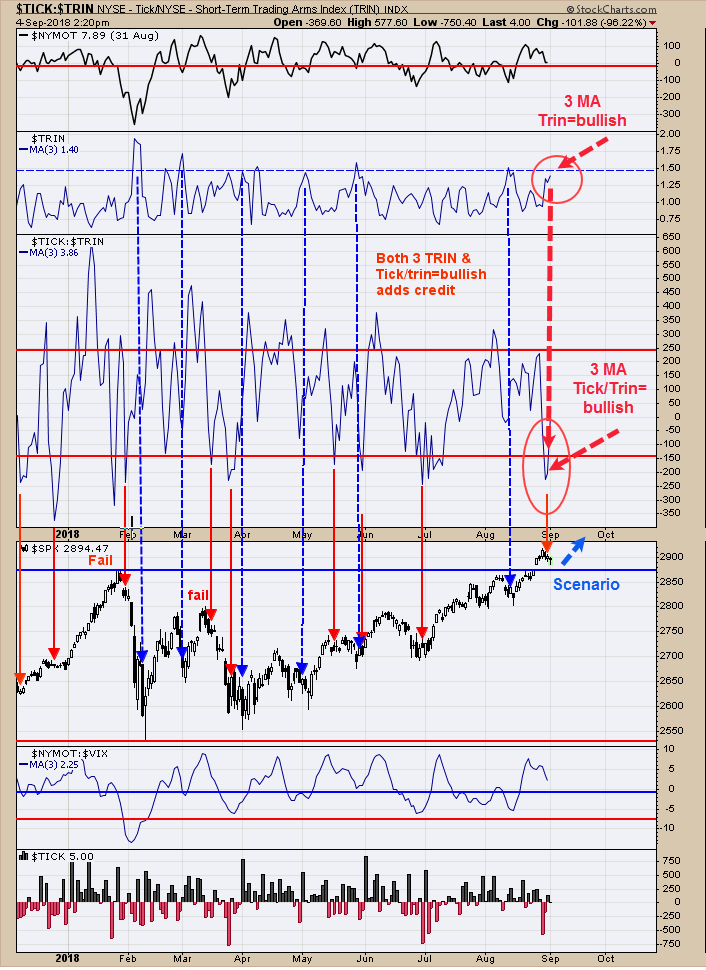
    Tick/Trin Ratio

    This chart was updated about 1½ hour before the close. The “3 MA of the TRIN” and “3 MA of the Tick/Trin ratio” remain near bullish levels and it doesn’t appear a significant pull back is in the making. The second window down from the top is the “3 day average of the trin”. Reading near 1.50 and above appear near short term lows and the current reading is 1.40. Next window down is the “3 day average of the Tick/Trin ratio”. When the ratio reaches below -150 (reached -201.39 last Thursday) the market is usually near a low. When both indicators are near or in bullish levels than the degree of success increases and that is what we have here. It appears with today’s indicator readings suggest support can be found near the January high at the 2870 range. We are back long SPX on 8/31/18 at 2901.52.

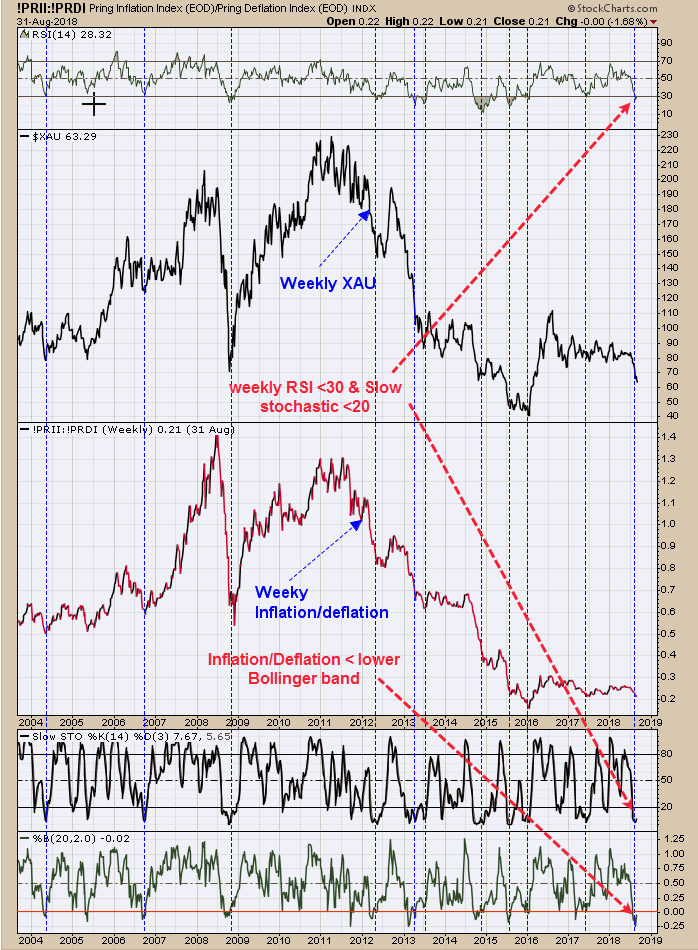
    Weekly Inflation/Deflation Ratio

    The weekly Inflation/Deflation ratio (updated to last Friday’s close) produced a weekly RSI less than 30 (closed 28.32) and the weekly Slow Stochastic less than 20 (closed 7.67) along with this ratio closing below it lower Bollinger® band, which suggests the market has hit capitulation. The COT commercials for Gold with a short position of only -1685 hit on August 21 suggest gold at a major low. The last time Gold Commercials where this low (-2915) came on November 30, 2015 which was a major low. Long GDX at 18.72 on 8/17/18. New Book release "The Secret Science of Price and Volume" by Timothy Ord.

Latest comments

Loading next article…
Risk Disclosure: Trading in financial instruments and/or cryptocurrencies involves high risks including the risk of losing some, or all, of your investment amount, and may not be suitable for all investors. Prices of cryptocurrencies are extremely volatile and may be affected by external factors such as financial, regulatory or political events. Trading on margin increases the financial risks.
Before deciding to trade in financial instrument or cryptocurrencies you should be fully informed of the risks and costs associated with trading the financial markets, carefully consider your investment objectives, level of experience, and risk appetite, and seek professional advice where needed.
Fusion Media would like to remind you that the data contained in this website is not necessarily real-time nor accurate. The data and prices on the website are not necessarily provided by any market or exchange, but may be provided by market makers, and so prices may not be accurate and may differ from the actual price at any given market, meaning prices are indicative and not appropriate for trading purposes. Fusion Media and any provider of the data contained in this website will not accept liability for any loss or damage as a result of your trading, or your reliance on the information contained within this website.
It is prohibited to use, store, reproduce, display, modify, transmit or distribute the data contained in this website without the explicit prior written permission of Fusion Media and/or the data provider. All intellectual property rights are reserved by the providers and/or the exchange providing the data contained in this website.
Fusion Media may be compensated by the advertisers that appear on the website, based on your interaction with the advertisements or advertisers.
© 2007-2024 - Fusion Media Limited. All Rights Reserved.